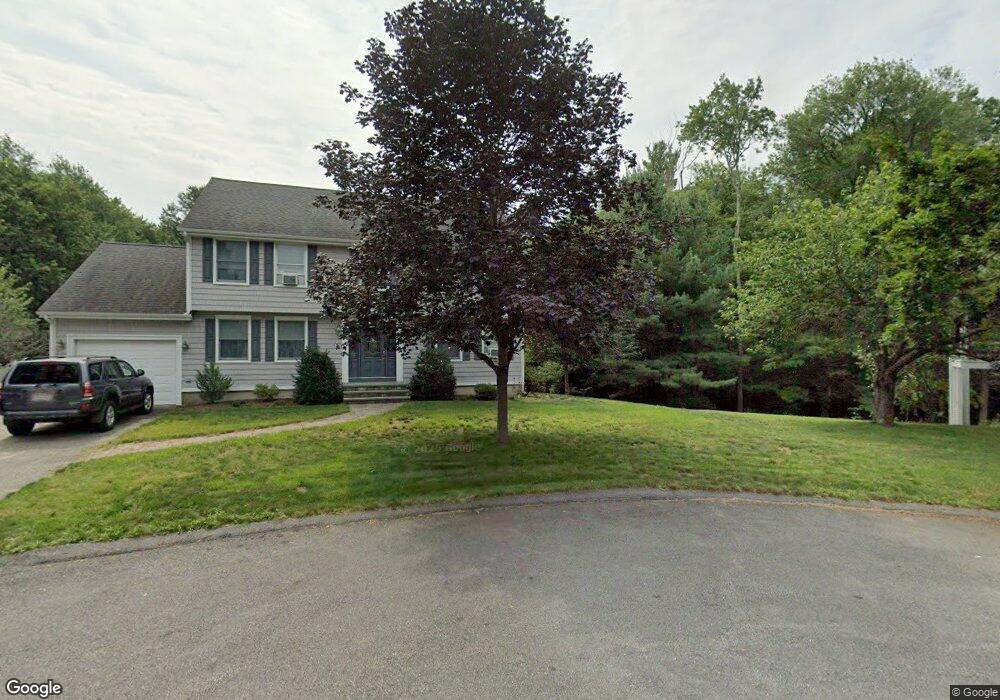
3 Dale St Burlington, MA 01803
Havenville NeighborhoodEstimated Value: $878,000 - $1,215,000
4
Beds
3
Baths
2,052
Sq Ft
$519/Sq Ft
Est. Value
About This Home
This home is located at 3 Dale St, Burlington, MA 01803 and is currently estimated at $1,065,221, approximately $519 per square foot. 3 Dale St is a home located in Middlesex County with nearby schools including Burlington High School, Marshall Simonds Middle School, and Mount Hope Christian School.
Ownership History
Date
Name
Owned For
Owner Type
Purchase Details
Closed on
Sep 7, 1994
Sold by
Constr Inc
Bought by
Ostlund Kenneth D and Ostlund Janet T
Current Estimated Value
Home Financials for this Owner
Home Financials are based on the most recent Mortgage that was taken out on this home.
Original Mortgage
$195,000
Interest Rate
8.54%
Mortgage Type
Purchase Money Mortgage
Create a Home Valuation Report for This Property
The Home Valuation Report is an in-depth analysis detailing your home's value as well as a comparison with similar homes in the area
Home Values in the Area
Average Home Value in this Area
Purchase History
| Date | Buyer | Sale Price | Title Company |
|---|---|---|---|
| Ostlund Kenneth D | $252,000 | -- | |
| Ostlund Kenneth D | $252,000 | -- |
Source: Public Records
Mortgage History
| Date | Status | Borrower | Loan Amount |
|---|---|---|---|
| Open | Ostlund Kenneth D | $125,000 | |
| Closed | Ostlund Kenneth D | $30,000 | |
| Closed | Ostlund Kenneth D | $189,500 | |
| Closed | Ostlund Kenneth D | $195,000 |
Source: Public Records
Tax History Compared to Growth
Tax History
| Year | Tax Paid | Tax Assessment Tax Assessment Total Assessment is a certain percentage of the fair market value that is determined by local assessors to be the total taxable value of land and additions on the property. | Land | Improvement |
|---|---|---|---|---|
| 2025 | $7,587 | $876,100 | $440,400 | $435,700 |
| 2024 | $7,300 | $816,600 | $402,100 | $414,500 |
| 2023 | $7,091 | $754,400 | $348,900 | $405,500 |
| 2022 | $6,901 | $693,600 | $317,600 | $376,000 |
| 2021 | $6,750 | $678,400 | $302,400 | $376,000 |
| 2020 | $6,430 | $667,000 | $297,600 | $369,400 |
| 2019 | $6,356 | $606,500 | $278,600 | $327,900 |
| 2018 | $6,298 | $593,000 | $278,600 | $314,400 |
| 2017 | $6,142 | $593,000 | $278,600 | $314,400 |
| 2016 | $6,104 | $532,600 | $240,600 | $292,000 |
| 2015 | $6,045 | $532,600 | $240,600 | $292,000 |
| 2014 | $5,878 | $489,800 | $208,300 | $281,500 |
Source: Public Records
Map
Nearby Homes
- 27 Purity Springs Rd
- 6 Arthur Woods Ave
- 10 Murray Ave Unit 15
- 12 Murray Ave Unit 18
- 20 Lantern Ln
- 129 Cambridge St Unit 1
- 1 Violet Rd
- 68 Macon Rd
- 42 Lantern Ln
- 210 Winn St
- 3 County Rd
- 11 Violet Rd
- 5 Shady Lane Dr
- 38 Freeport Dr
- 51 Terrace Hall Ave
- 12 Pleasant St
- 1 Hallmark Gardens Unit 8
- 5 Hallmark Gardens Unit 7
- 2 Cutting Ln
- 9 Wing Terrace