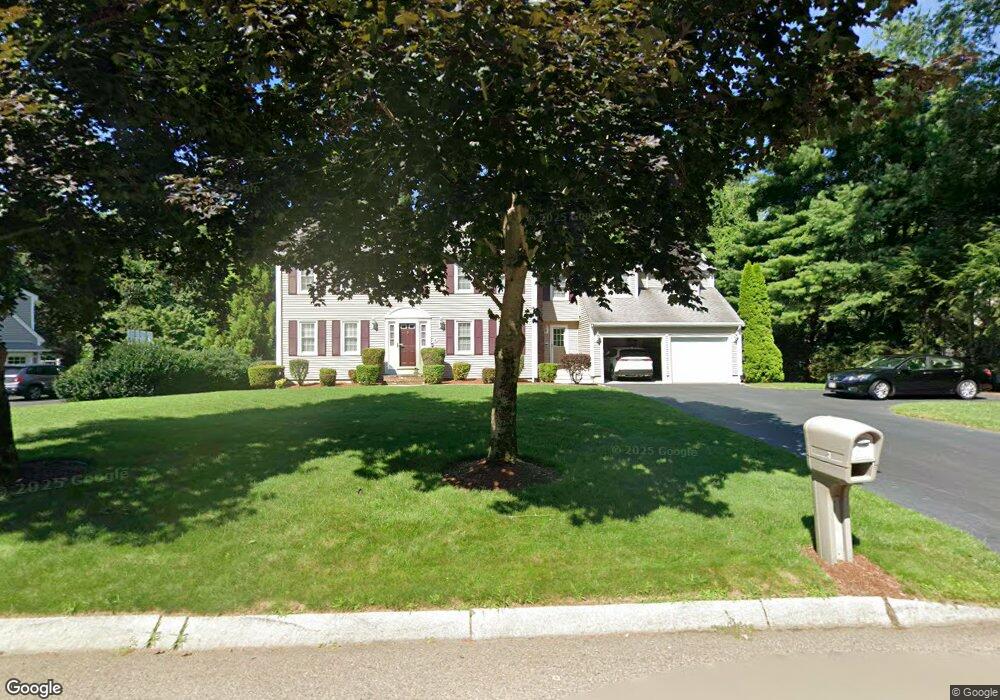
3 Danielle St Norton, MA 02766
Estimated Value: $777,414 - $991,000
4
Beds
3
Baths
2,590
Sq Ft
$339/Sq Ft
Est. Value
About This Home
This home is located at 3 Danielle St, Norton, MA 02766 and is currently estimated at $879,104, approximately $339 per square foot. 3 Danielle St is a home located in Bristol County with nearby schools including J.C. Solmonese Elementary School, Henri A. Yelle Elementary School, and Norton Middle School.
Ownership History
Date
Name
Owned For
Owner Type
Purchase Details
Closed on
Jul 25, 2001
Sold by
Renaghan Robert M and Renaghan Darcy P
Bought by
Leafer Scott A and Leafer Michelle M
Current Estimated Value
Purchase Details
Closed on
Jun 25, 1999
Sold by
Hughes Gerald and Hughes Elizabeth
Bought by
Renaghan Robert M and Renaghan Darcy P
Purchase Details
Closed on
Nov 19, 1996
Sold by
Solomon Randy J and Solomon Elizabeth R
Bought by
Hughes Gerald and Hughes Elizabeth
Purchase Details
Closed on
Jun 3, 1994
Sold by
Pasqualino Angelo and W & G Todd Of Norton Rt
Bought by
P & A Constr Inc
Purchase Details
Closed on
Nov 29, 1991
Sold by
P & A Construction Inc
Bought by
Solomon Randy J and Solomon Elizabeth
Create a Home Valuation Report for This Property
The Home Valuation Report is an in-depth analysis detailing your home's value as well as a comparison with similar homes in the area
Home Values in the Area
Average Home Value in this Area
Purchase History
| Date | Buyer | Sale Price | Title Company |
|---|---|---|---|
| Leafer Scott A | $372,000 | -- | |
| Renaghan Robert M | $299,900 | -- | |
| Hughes Gerald | $191,000 | -- | |
| P & A Constr Inc | $60,000 | -- | |
| Solomon Randy J | $160,650 | -- |
Source: Public Records
Mortgage History
| Date | Status | Borrower | Loan Amount |
|---|---|---|---|
| Open | Solomon Randy J | $194,000 | |
| Closed | Solomon Randy J | $99,000 |
Source: Public Records
Tax History
| Year | Tax Paid | Tax Assessment Tax Assessment Total Assessment is a certain percentage of the fair market value that is determined by local assessors to be the total taxable value of land and additions on the property. | Land | Improvement |
|---|---|---|---|---|
| 2025 | $88 | $678,000 | $218,300 | $459,700 |
| 2024 | $8,256 | $637,500 | $207,900 | $429,600 |
| 2023 | $7,884 | $606,900 | $196,100 | $410,800 |
| 2022 | $7,568 | $530,700 | $178,300 | $352,400 |
| 2021 | $7,223 | $483,800 | $169,800 | $314,000 |
| 2020 | $6,956 | $470,000 | $164,800 | $305,200 |
| 2019 | $6,705 | $450,000 | $158,600 | $291,400 |
| 2018 | $6,649 | $438,600 | $158,600 | $280,000 |
| 2017 | $6,425 | $418,000 | $158,600 | $259,400 |
| 2016 | $6,171 | $395,300 | $158,600 | $236,700 |
| 2015 | $5,990 | $389,200 | $155,400 | $233,800 |
| 2014 | $5,556 | $361,500 | $135,700 | $225,800 |
Source: Public Records
Map
Nearby Homes
- 170 S Worcester St Unit 3
- 26 Barrows Ct
- 34 Barrows St
- 125 John Scott Blvd
- 127 John Scott Blvd
- 108 S Worcester St
- 2 Edgewater Dr Unit 2
- 3 Gilberts Way
- 20 Lloyd Cir Unit 32
- 14 Lloyd Cir Unit 29
- 5 Robin Cir Unit 5
- 55 Sturdy St
- 196 Taunton Ave Unit B
- 90 Pine St
- 29 Germain Way Unit 3
- 152 Pine St Unit 23
- 8 Kasmira Way
- 11 Lloyd Cir Unit 39
- 13 Lloyd Cir Unit 34
- 93 Mansfield Ave
Your Personal Tour Guide
Ask me questions while you tour the home.