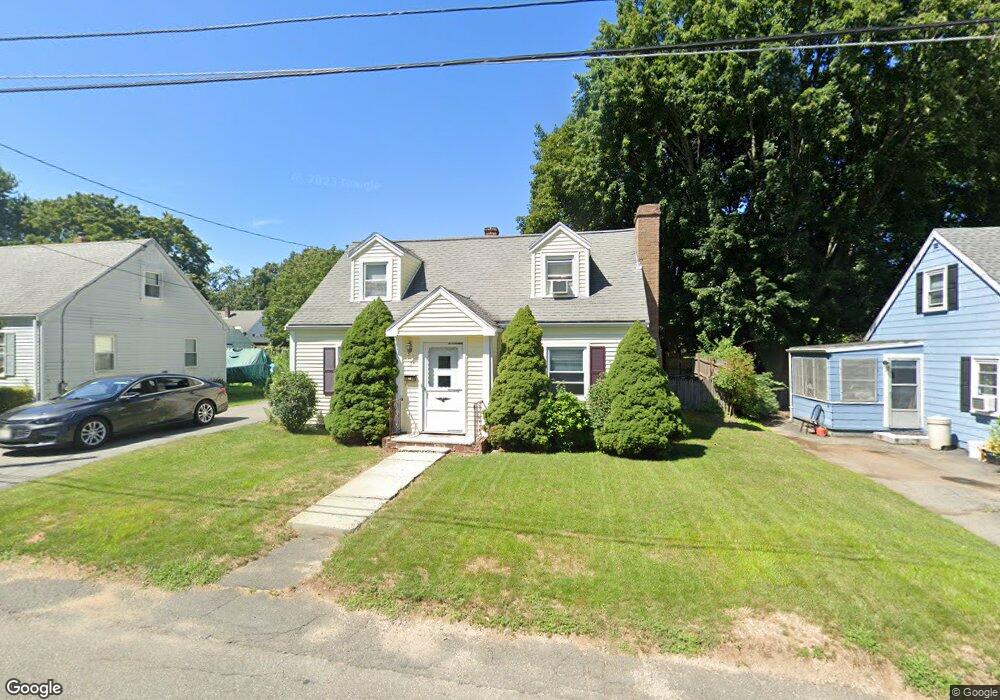
3 Deb Rd Woburn, MA 01801
Downtown Woburn NeighborhoodEstimated Value: $668,000 - $788,000
4
Beds
2
Baths
1,944
Sq Ft
$372/Sq Ft
Est. Value
About This Home
This home is located at 3 Deb Rd, Woburn, MA 01801 and is currently estimated at $722,228, approximately $371 per square foot. 3 Deb Rd is a home located in Middlesex County with nearby schools including Goodyear Elementary School, John F. Kennedy Middle School, and Woburn High School.
Ownership History
Date
Name
Owned For
Owner Type
Purchase Details
Closed on
Nov 24, 1998
Sold by
Fhlmc
Bought by
Stack David and Stack Catherine F
Current Estimated Value
Home Financials for this Owner
Home Financials are based on the most recent Mortgage that was taken out on this home.
Original Mortgage
$165,445
Interest Rate
6.49%
Mortgage Type
Purchase Money Mortgage
Purchase Details
Closed on
Jun 15, 1998
Sold by
Murphy Frederick L and Murphy Jacqueline M
Bought by
Fhlmc
Home Financials for this Owner
Home Financials are based on the most recent Mortgage that was taken out on this home.
Original Mortgage
$45,000
Interest Rate
7.11%
Mortgage Type
Purchase Money Mortgage
Create a Home Valuation Report for This Property
The Home Valuation Report is an in-depth analysis detailing your home's value as well as a comparison with similar homes in the area
Home Values in the Area
Average Home Value in this Area
Purchase History
| Date | Buyer | Sale Price | Title Company |
|---|---|---|---|
| Stack David | $178,000 | -- | |
| Fhlmc | $158,403 | -- |
Source: Public Records
Mortgage History
| Date | Status | Borrower | Loan Amount |
|---|---|---|---|
| Open | Fhlmc | $198,000 | |
| Closed | Fhlmc | $165,445 | |
| Previous Owner | Fhlmc | $45,000 |
Source: Public Records
Tax History
| Year | Tax Paid | Tax Assessment Tax Assessment Total Assessment is a certain percentage of the fair market value that is determined by local assessors to be the total taxable value of land and additions on the property. | Land | Improvement |
|---|---|---|---|---|
| 2025 | $5,285 | $618,800 | $296,700 | $322,100 |
| 2024 | $4,751 | $589,400 | $282,600 | $306,800 |
| 2023 | $4,684 | $538,400 | $256,900 | $281,500 |
| 2022 | $4,561 | $488,300 | $223,400 | $264,900 |
| 2021 | $4,301 | $461,000 | $212,800 | $248,200 |
| 2020 | $14,862 | $438,800 | $212,800 | $226,000 |
| 2019 | $14,443 | $436,700 | $202,600 | $234,100 |
| 2018 | $3,986 | $403,000 | $185,900 | $217,100 |
| 2017 | $3,733 | $375,600 | $177,100 | $198,500 |
| 2016 | $3,569 | $355,100 | $165,500 | $189,600 |
| 2015 | $3,442 | $338,400 | $154,700 | $183,700 |
| 2014 | $3,207 | $307,200 | $154,700 | $152,500 |
Source: Public Records
Map
Nearby Homes
- 31 Tremont St
- 18 Central St
- 16 Felton St
- 21 Eastern Ave
- 39 Jefferson Ave
- 3 Golden Terrace
- 0 Mount Pleasant St
- 6 Highland St
- 6 Stratton Dr Unit 3303
- 6 Stratton Dr Unit 208
- 6 Stratton Dr Unit 3307
- 35 Montvale Ave Unit 8
- 31 Montvale Ave Unit 2
- 2 Mason Way Unit 6524
- 6 Mason Way Unit 63
- 7 Prospect St
- 477 Main St
- 9 Charles Rd
- 20 Charles Rd
- 18 Church St Unit 2
Your Personal Tour Guide
Ask me questions while you tour the home.