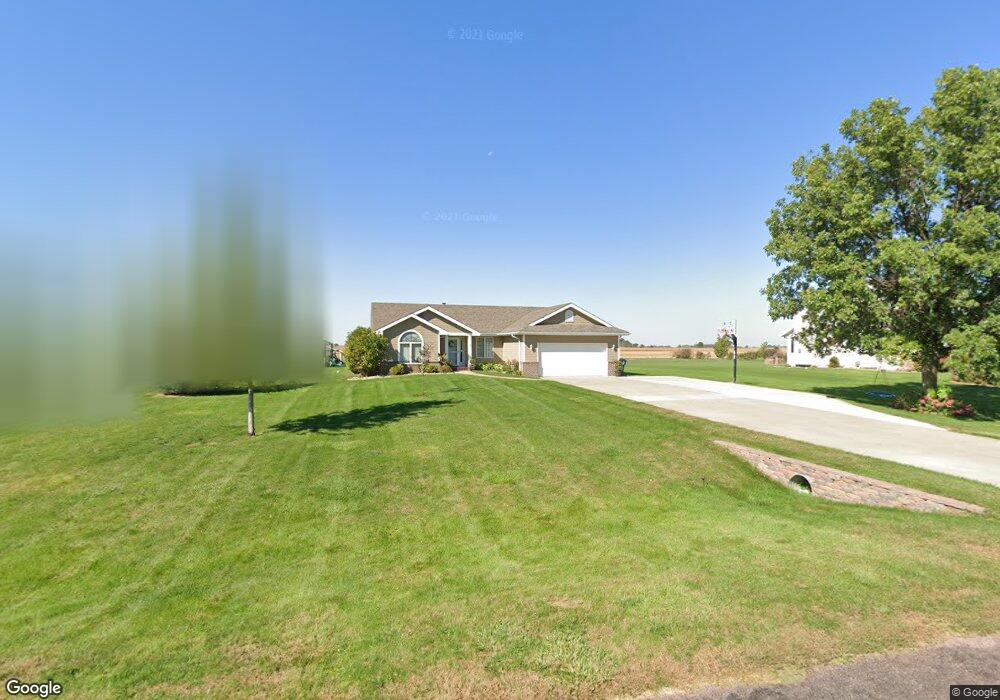
3 Deer Run Cir McCook Lake, SD 57049
Estimated Value: $394,574 - $562,000
5
Beds
3
Baths
1,488
Sq Ft
$323/Sq Ft
Est. Value
About This Home
This home is located at 3 Deer Run Cir, McCook Lake, SD 57049 and is currently estimated at $480,894, approximately $323 per square foot. 3 Deer Run Cir is a home located in Union County with nearby schools including Dakota Valley Elementary School, Dakota Valley Junior High School, and Dakota Valley High School.
Ownership History
Date
Name
Owned For
Owner Type
Purchase Details
Closed on
Mar 4, 2013
Sold by
Bigler Sean C and Bigler Stacy J
Bought by
Langley Douglas A and Langley Stacey M
Current Estimated Value
Home Financials for this Owner
Home Financials are based on the most recent Mortgage that was taken out on this home.
Original Mortgage
$125,000
Outstanding Balance
$24,646
Interest Rate
3.38%
Mortgage Type
New Conventional
Estimated Equity
$456,248
Purchase Details
Closed on
Apr 9, 2009
Sold by
Cross Patrick S and Cross Audrey K
Bought by
Bigler Sean C and Bigler Stacy J
Home Financials for this Owner
Home Financials are based on the most recent Mortgage that was taken out on this home.
Original Mortgage
$233,458
Interest Rate
5.19%
Mortgage Type
New Conventional
Create a Home Valuation Report for This Property
The Home Valuation Report is an in-depth analysis detailing your home's value as well as a comparison with similar homes in the area
Purchase History
| Date | Buyer | Sale Price | Title Company |
|---|---|---|---|
| Langley Douglas A | $237,000 | None Available | |
| Bigler Sean C | $226,000 | None Available |
Source: Public Records
Mortgage History
| Date | Status | Borrower | Loan Amount |
|---|---|---|---|
| Open | Langley Douglas A | $125,000 | |
| Previous Owner | Bigler Sean C | $233,458 |
Source: Public Records
Tax History
| Year | Tax Paid | Tax Assessment Tax Assessment Total Assessment is a certain percentage of the fair market value that is determined by local assessors to be the total taxable value of land and additions on the property. | Land | Improvement |
|---|---|---|---|---|
| 2025 | $4,419 | $355,421 | $25,635 | $329,786 |
| 2024 | $4,419 | $355,421 | $25,635 | $329,786 |
| 2023 | $3,534 | $300,675 | $25,635 | $275,040 |
| 2022 | $3,519 | $261,708 | $22,372 | $239,336 |
| 2021 | $3,461 | $261,708 | $22,372 | $239,336 |
| 2020 | $3,501 | $250,373 | $22,372 | $228,001 |
| 2019 | $3,363 | $23,682 | $22,372 | $1,310 |
| 2018 | $2,578 | $23,682 | $22,372 | $1,310 |
| 2017 | $2,532 | $184,502 | $0 | $184,502 |
| 2016 | $2,519 | $184,502 | $0 | $184,502 |
| 2015 | $2,519 | $184,502 | $0 | $184,502 |
| 2014 | $2,566 | $184,502 | $0 | $184,502 |
| 2013 | $2,672 | $182,902 | $0 | $182,902 |
| 2012 | $2,672 | $188,347 | $22,372 | $165,975 |
Source: Public Records
Map
Nearby Homes
- 914 Wynstone Dr
- 117 Northshore Dr
- 920 Wynstone Dr
- 849 Brookside Dr
- 946 Wynstone Dr
- 832 Brookside Dr
- 836 Brookside Dr
- 813 Brookside Dr
- 4280 N Hwy 105
- 349 Lakeshore Dr
- 48220 332 St
- 388 Lakeshore Dr
- 2 Union Ct
- 992 Wynstone Dr
- 908 S Turtle Cove
- 910 S Turtle Cove
- 114 Cott's Dr
- 58 Sunset Dr
- 931 Campbell St
- 201 N Main St
- 4 Deer Run Cir
- 2 Deer Run Cir
- 38 Deer Run Cir
- 39 Deer Run Cir
- 5 Deer Run Cir
- 1 Deer Run Cir
- 40 Deer Run Cir
- 36 Deer Run Cir
- 6 Deer Run Cir
- 35 Deer Run Cir
- 7 Deer Run Cir
- 34 Deer Run Cir
- 26 Deer Run Cir
- 8 Deer Run Cir
- 25 Deer Run Cir
- 27 Deer Run Cir
- 33 Deer Run Cir
- 28 Deer Run Cir
- 9 Deer Run Cir
- 30 Deer Run Cir
Your Personal Tour Guide
Ask me questions while you tour the home.