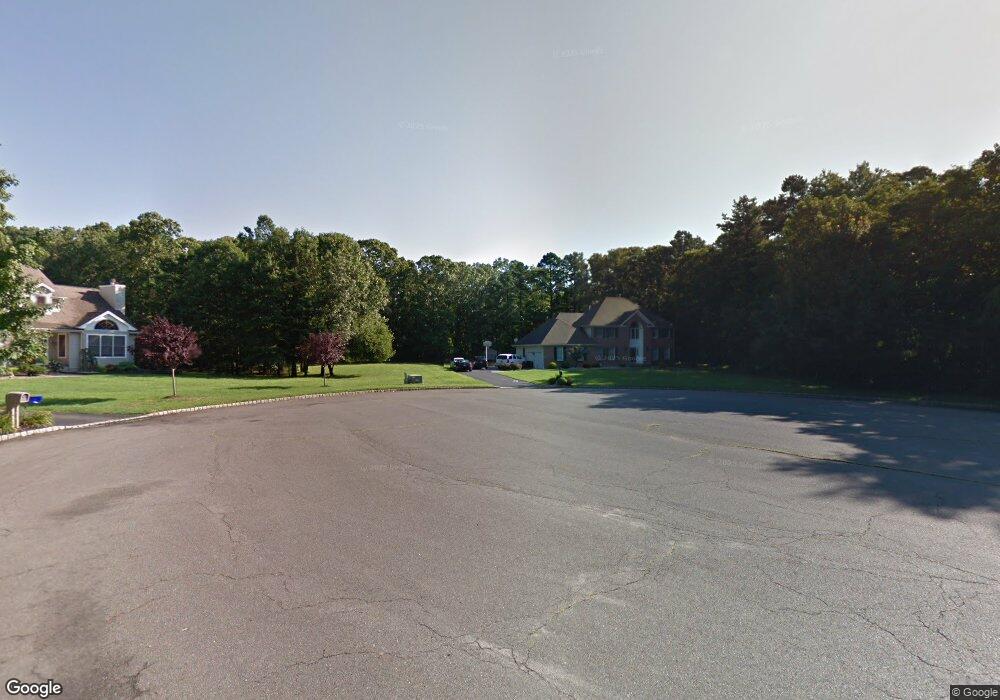
3 Dickens Ct Howell, NJ 07731
East Howell NeighborhoodEstimated Value: $914,569 - $1,162,000
4
Beds
2
Baths
3,118
Sq Ft
$323/Sq Ft
Est. Value
About This Home
This home is located at 3 Dickens Ct, Howell, NJ 07731 and is currently estimated at $1,005,892, approximately $322 per square foot. 3 Dickens Ct is a home located in Monmouth County with nearby schools including Taunton School, Aldrich School, and Howell Township Middle School South.
Ownership History
Date
Name
Owned For
Owner Type
Purchase Details
Closed on
Apr 1, 2011
Sold by
Swindlehurst Warren and Keegan Janis
Bought by
Swindlehurst Warren and Swindlehurst Janis
Current Estimated Value
Purchase Details
Closed on
May 1, 2003
Sold by
Gray Peter
Bought by
Swindlehurst Waren and Keegan Janis
Home Financials for this Owner
Home Financials are based on the most recent Mortgage that was taken out on this home.
Original Mortgage
$322,700
Interest Rate
5.83%
Create a Home Valuation Report for This Property
The Home Valuation Report is an in-depth analysis detailing your home's value as well as a comparison with similar homes in the area
Home Values in the Area
Average Home Value in this Area
Purchase History
| Date | Buyer | Sale Price | Title Company |
|---|---|---|---|
| Swindlehurst Warren | -- | None Available | |
| Swindlehurst Waren | $460,000 | -- |
Source: Public Records
Mortgage History
| Date | Status | Borrower | Loan Amount |
|---|---|---|---|
| Previous Owner | Swindlehurst Waren | $322,700 |
Source: Public Records
Tax History
| Year | Tax Paid | Tax Assessment Tax Assessment Total Assessment is a certain percentage of the fair market value that is determined by local assessors to be the total taxable value of land and additions on the property. | Land | Improvement |
|---|---|---|---|---|
| 2025 | $12,336 | $721,300 | $256,500 | $464,800 |
| 2024 | $11,951 | $693,800 | $237,500 | $456,300 |
Source: Public Records
Map
Nearby Homes
- 17 Amanda Ln
- 9 Amanda Ln
- 2 Haystack Ct
- 1070 Maxim Southard Rd
- 4 Haystack Ct
- 8 Haystack Ct
- 1300 Maxim Southard Rd
- 26 N Westfield Rd
- 140 Locust Ave
- 27 Jennifer Dr
- 935 Lakewood Farmingdale Rd
- 6 Taft St
- 251 Oak Glen Rd
- 48 Hedgewood Rd
- 9 US Highway 9
- 19 Bertan Ave
- 239 Oak Glen Rd
- 126 Newbury Rd
- 1 Max Place Unit 1
- 307 Princeton Dr
Your Personal Tour Guide
Ask me questions while you tour the home.