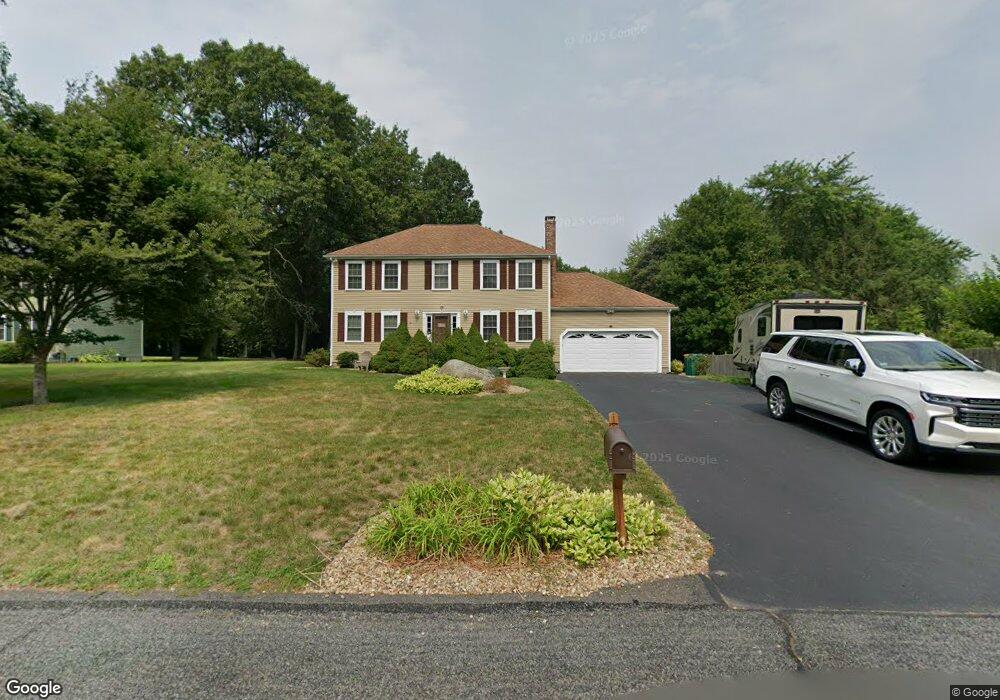
3 Donovan Ln Mansfield, MA 02048
Estimated Value: $745,156 - $965,000
3
Beds
2
Baths
1,872
Sq Ft
$437/Sq Ft
Est. Value
About This Home
This home is located at 3 Donovan Ln, Mansfield, MA 02048 and is currently estimated at $817,289, approximately $436 per square foot. 3 Donovan Ln is a home located in Bristol County with nearby schools including Everett W. Robinson Elementary School, Jordan/Jackson Elementary School, and Harold L. Qualters Middle School.
Ownership History
Date
Name
Owned For
Owner Type
Purchase Details
Closed on
Mar 18, 2009
Sold by
Larm Arthur W and Larm Debra J
Bought by
Smeriglio Tr Richard J and Mages Donna
Current Estimated Value
Purchase Details
Closed on
Dec 16, 1992
Sold by
Nguyen Tan D and Uong Kim Anh
Bought by
Larm Arthur W and Larm Debra J
Home Financials for this Owner
Home Financials are based on the most recent Mortgage that was taken out on this home.
Original Mortgage
$166,500
Interest Rate
8.3%
Mortgage Type
Purchase Money Mortgage
Create a Home Valuation Report for This Property
The Home Valuation Report is an in-depth analysis detailing your home's value as well as a comparison with similar homes in the area
Home Values in the Area
Average Home Value in this Area
Purchase History
| Date | Buyer | Sale Price | Title Company |
|---|---|---|---|
| Smeriglio Tr Richard J | -- | -- | |
| Larm Arthur W | $185,000 | -- |
Source: Public Records
Mortgage History
| Date | Status | Borrower | Loan Amount |
|---|---|---|---|
| Previous Owner | Larm Arthur W | $111,500 | |
| Previous Owner | Larm Arthur W | $41,000 | |
| Previous Owner | Larm Arthur W | $165,000 | |
| Previous Owner | Larm Arthur W | $166,500 |
Source: Public Records
Tax History
| Year | Tax Paid | Tax Assessment Tax Assessment Total Assessment is a certain percentage of the fair market value that is determined by local assessors to be the total taxable value of land and additions on the property. | Land | Improvement |
|---|---|---|---|---|
| 2025 | $8,848 | $671,800 | $278,200 | $393,600 |
| 2024 | $8,789 | $651,000 | $290,300 | $360,700 |
| 2023 | $8,540 | $606,100 | $290,300 | $315,800 |
| 2022 | $8,207 | $541,000 | $268,700 | $272,300 |
| 2021 | $7,869 | $512,300 | $224,000 | $288,300 |
| 2020 | $7,752 | $504,700 | $224,000 | $280,700 |
| 2019 | $7,150 | $469,800 | $186,600 | $283,200 |
| 2018 | $6,772 | $456,000 | $177,900 | $278,100 |
| 2017 | $6,660 | $443,400 | $172,900 | $270,500 |
| 2016 | $6,435 | $417,600 | $164,600 | $253,000 |
| 2015 | $6,273 | $404,700 | $164,600 | $240,100 |
Source: Public Records
Map
Nearby Homes
- 1769 West St
- 24 Maverick Dr
- 346 South St
- 85 Jewell St
- 40 Treasure Island Rd
- 152 Central St
- 166 Chauncy St
- 16 Treasure Island Rd
- 356 Central St
- 14 Claire Ave
- 150 Gilbert St
- 9 Coach Rd
- 33 Colonial Way
- 84 Messenger St
- 150 Rumford Ave Unit 110
- 46 Mirimichi St
- 266 N Main St Unit 3
- 155 South St
- 22 Pleasant St Unit C
- 28 Court St
Your Personal Tour Guide
Ask me questions while you tour the home.