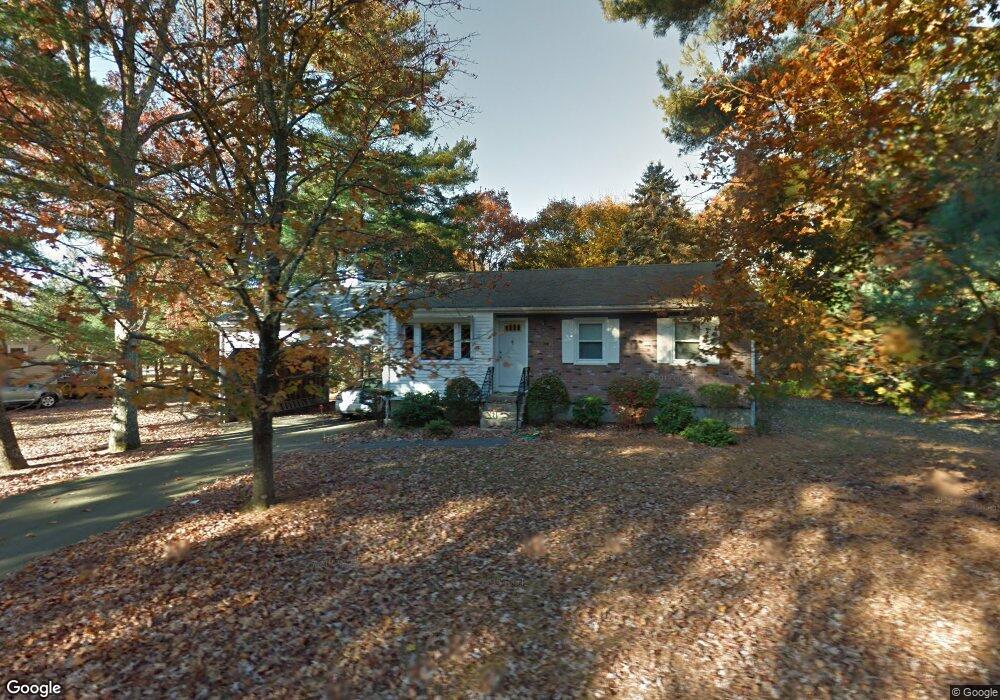
3 Douglas St Medway, MA 02053
Estimated Value: $475,000 - $629,000
3
Beds
1
Bath
1,204
Sq Ft
$471/Sq Ft
Est. Value
About This Home
This home is located at 3 Douglas St, Medway, MA 02053 and is currently estimated at $566,957, approximately $470 per square foot. 3 Douglas St is a home located in Norfolk County with nearby schools including John D. McGovern Elementary School, Burke-Memorial Elementary, and Medway Middle School.
Ownership History
Date
Name
Owned For
Owner Type
Purchase Details
Closed on
Jun 30, 2015
Sold by
Mampe Adrian G and Goldberg Robyn
Bought by
Gill Dayna and Mccabe Matthew
Current Estimated Value
Home Financials for this Owner
Home Financials are based on the most recent Mortgage that was taken out on this home.
Original Mortgage
$252,200
Outstanding Balance
$196,513
Interest Rate
3.84%
Mortgage Type
New Conventional
Estimated Equity
$370,444
Create a Home Valuation Report for This Property
The Home Valuation Report is an in-depth analysis detailing your home's value as well as a comparison with similar homes in the area
Home Values in the Area
Average Home Value in this Area
Purchase History
| Date | Buyer | Sale Price | Title Company |
|---|---|---|---|
| Gill Dayna | $260,000 | -- |
Source: Public Records
Mortgage History
| Date | Status | Borrower | Loan Amount |
|---|---|---|---|
| Open | Gill Dayna | $252,200 |
Source: Public Records
Tax History Compared to Growth
Tax History
| Year | Tax Paid | Tax Assessment Tax Assessment Total Assessment is a certain percentage of the fair market value that is determined by local assessors to be the total taxable value of land and additions on the property. | Land | Improvement |
|---|---|---|---|---|
| 2025 | $6,957 | $488,200 | $283,300 | $204,900 |
| 2024 | $7,030 | $488,200 | $283,300 | $204,900 |
| 2023 | $6,513 | $408,600 | $234,700 | $173,900 |
| 2022 | $6,008 | $354,900 | $208,400 | $146,500 |
| 2021 | $5,681 | $325,400 | $192,200 | $133,200 |
| 2020 | $5,448 | $311,300 | $178,100 | $133,200 |
| 2019 | $5,217 | $307,400 | $178,100 | $129,300 |
| 2018 | $5,286 | $299,300 | $170,000 | $129,300 |
| 2017 | $4,975 | $277,600 | $153,800 | $123,800 |
| 2016 | $4,600 | $254,000 | $136,000 | $118,000 |
| 2015 | $4,339 | $237,900 | $121,400 | $116,500 |
| 2014 | -- | $230,800 | $129,500 | $101,300 |
Source: Public Records
Map
Nearby Homes
- 50 Main St
- 3 Meryl St
- 106 Holliston St
- 12 Lovering St
- 22 Sunset Dr
- 36 Lovering St
- 1 Walnut Ln
- 14 Heritage Dr
- 30 Broken Tree Rd
- 20 Broad St Unit 6
- 20 Broad St Unit A
- 20 Broad St Unit 4
- 9 Sanford St
- 14 Sanford St Unit 15
- 16 Lexington Ln
- 280 Village St Unit D2
- 4 Shaw St
- 2 Spencer St
- 176 Main St Unit 3
- 841 Lincoln St