
Landlord's Agent in 2024
Stephen DeStefano
Century 21 Circa 72 Inc.
(603) 496-3674
49 in this area
104 Total Sales
Estimated Value: $797,000 - $832,990
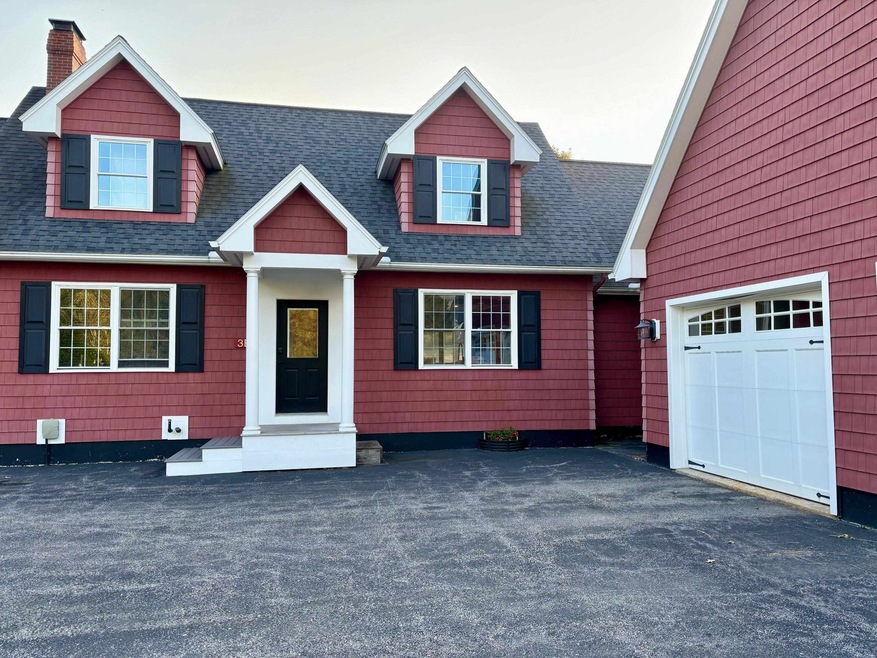
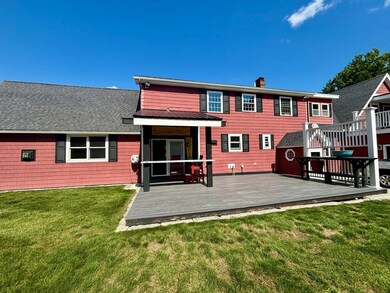
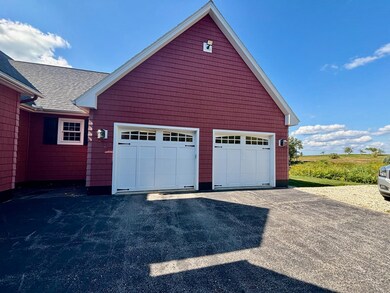
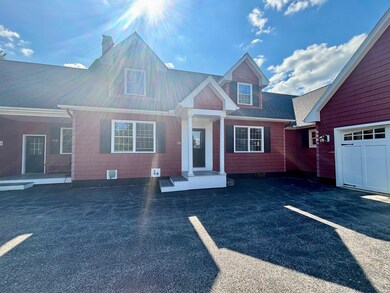
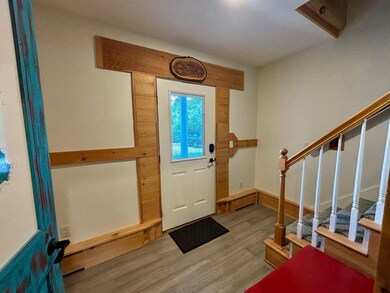
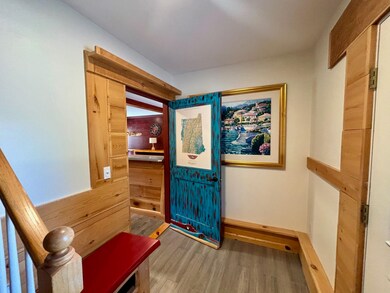
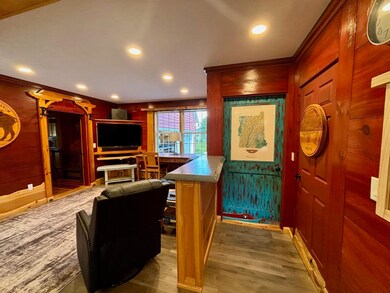
This one of a kind Bow rental is fully furnished and includes all utilities ! The Wooden Nickel Ranch is situated on 7 acres of rolling land, with mountain views and is walking distance to 60 acres of the Hammond conservation trails. This pristine single level space has just been completed and is ready for immediate occupancy for the the right tenant. Tastefully decorated with brand new furniture, King size mattress and custom built pieces. Attention to detail is evident in all aspects of the property, with pine cabinetry, new Luxury Vinyl and pine flooring & built-ins and tons of storage. Kitchen offers stainless steel appliances and opens to Living & Dining room. The Primary Bedroom has gorgeous pine floors, Walk in Tiled Shower, spacious walk in closet w/ built in desk. The Mud room and Laundry Room open from the attached garage with 1 dedicated bay .You will love the peaceful composite deck, which overlooks the private backyard ( designated lawn space ) All you need to do is to unpack your suitcase! Great commuter location ,equidistant to Concord and Manchester. Your happy place awaits!
Last Agent to Rent the Property
Century 21 Circa 72 Inc. License #011685 Listed on: 09/10/2024
Last Renter's Agent
Century 21 Circa 72 Inc. License #011685 Listed on: 09/10/2024
| Date | Event | Price | List to Sale | Price per Sq Ft |
|---|---|---|---|---|
| 10/25/2024 10/25/24 | Rented | $3,000 | 0.0% | -- |
| 09/28/2024 09/28/24 | Under Contract | -- | -- | -- |
| 09/10/2024 09/10/24 | For Rent | $3,000 | -99.9% | -- |
| 07/08/2021 07/08/21 | Rented | $2,500,000 | +99900.0% | -- |
| 06/01/2021 06/01/21 | Under Contract | -- | -- | -- |
| 04/26/2021 04/26/21 | Price Changed | $2,500 | -16.7% | $3 / Sq Ft |
| 03/25/2021 03/25/21 | For Rent | $3,000 | +20.0% | -- |
| 10/04/2020 10/04/20 | Rented | $2,500 | 0.0% | -- |
| 10/01/2020 10/01/20 | Under Contract | -- | -- | -- |
| 04/11/2020 04/11/20 | For Rent | $2,500 | -- | -- |
| Year | Tax Paid | Tax Assessment Tax Assessment Total Assessment is a certain percentage of the fair market value that is determined by local assessors to be the total taxable value of land and additions on the property. | Land | Improvement |
|---|---|---|---|---|
| 2025 | $16,224 | $809,200 | $182,100 | $627,100 |
| 2024 | $16,006 | $809,200 | $182,100 | $627,100 |
| 2023 | $14,367 | $516,600 | $117,400 | $399,200 |
| 2022 | $13,700 | $516,600 | $117,400 | $399,200 |
| 2021 | $12,786 | $501,600 | $117,400 | $384,200 |
| 2020 | $12,831 | $501,600 | $117,400 | $384,200 |
| 2019 | $13,147 | $501,600 | $117,400 | $384,200 |
| 2018 | $10,898 | $392,300 | $113,900 | $278,400 |
| 2017 | $10,894 | $392,300 | $113,900 | $278,400 |
| 2016 | $10,314 | $392,300 | $113,900 | $278,400 |
| 2015 | $9,921 | $347,600 | $113,900 | $233,700 |
| 2014 | $9,939 | $336,800 | $113,900 | $222,900 |
| 2011 | $6,711 | $247,200 | $113,900 | $133,300 |
Landlord's Agent in 2024
Stephen DeStefano
Century 21 Circa 72 Inc.
(603) 496-3674
49 in this area
104 Total Sales
Landlord's Co-Listing Agent in 2024
Joanne Chergey
Century 21 Circa 72 Inc.
(800) 439-9772
4 in this area
49 Total Sales
R
Buyer's Agent in 2021
Rebecca Spires
Coldwell Banker Realty Bedford NH
Buyer's Agent in 2020
Jerry Bligh
Keller Williams Realty-Metropolitan
2 Total Sales
Source: PrimeMLS
MLS Number: 5013604
APN: BOWW-000018-000003-000006-C000001
Disclaimer: Certain information contained herein is derived from information provided by parties other than Homes.com. All information provided is deemed reliable, but is not guaranteed to be accurate and should be independently verified.
![]() Copyright 2026 PrimeMLS, Inc. All rights reserved. This information is deemed reliable, but not guaranteed. The data relating to real estate displayed on this display comes in part from the IDX Program of PrimeMLS. The information being provided is for consumers’ personal, non-commercial use and may not be used for any purpose other than to identify prospective properties consumers may be interested in purchasing.
Copyright 2026 PrimeMLS, Inc. All rights reserved. This information is deemed reliable, but not guaranteed. The data relating to real estate displayed on this display comes in part from the IDX Program of PrimeMLS. The information being provided is for consumers’ personal, non-commercial use and may not be used for any purpose other than to identify prospective properties consumers may be interested in purchasing.
Ask me questions while you tour the home.