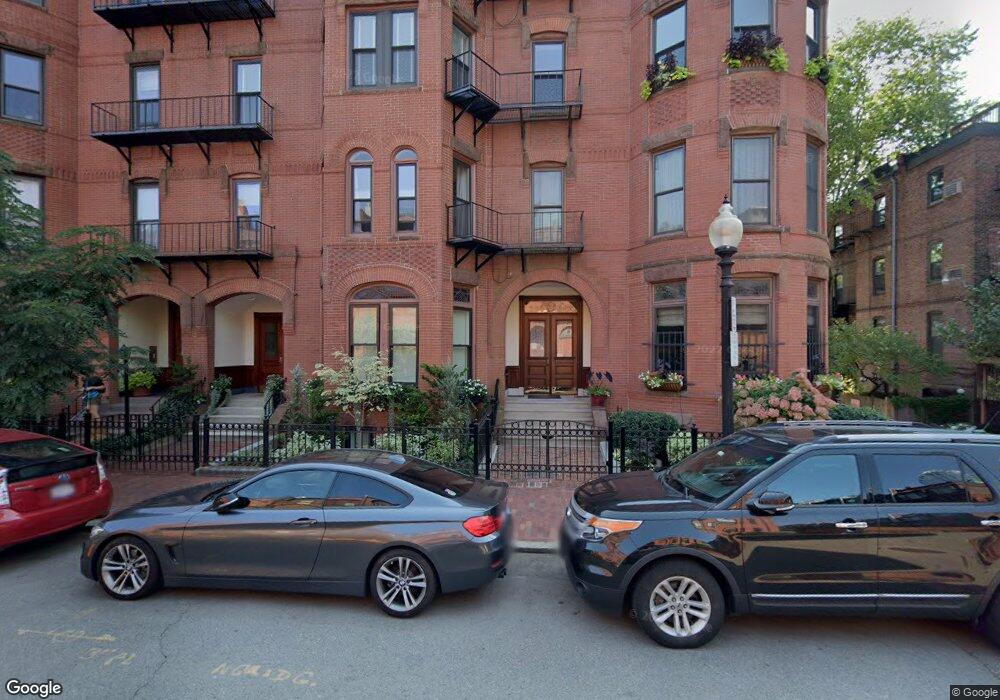
3 Durham St Unit 5 Boston, MA 02115
Back Bay NeighborhoodEstimated Value: $1,597,000 - $1,864,558
3
Beds
1
Bath
920
Sq Ft
$1,947/Sq Ft
Est. Value
About This Home
This home is located at 3 Durham St Unit 5, Boston, MA 02115 and is currently estimated at $1,790,890, approximately $1,946 per square foot. 3 Durham St Unit 5 is a home located in Suffolk County with nearby schools including Edward M. Kennedy Academy for Health Careers, Kingsley Montessori School, and Cathedral High School.
Ownership History
Date
Name
Owned For
Owner Type
Purchase Details
Closed on
Sep 25, 2020
Sold by
Pioli Susan F
Bought by
Samuels Martin and Pioli Susan F
Current Estimated Value
Home Financials for this Owner
Home Financials are based on the most recent Mortgage that was taken out on this home.
Original Mortgage
$510,400
Outstanding Balance
$451,916
Interest Rate
2.9%
Mortgage Type
New Conventional
Estimated Equity
$1,338,974
Purchase Details
Closed on
Apr 19, 2017
Sold by
Samuels Martin A and Pioli Susan F
Bought by
Pioli Susan F
Purchase Details
Closed on
Mar 19, 2009
Sold by
Samuels Martin A
Bought by
Samuels Martin A and Pioli Susan F
Purchase Details
Closed on
May 15, 2000
Sold by
Diehl April S and Garrett April S
Bought by
Samuels Martin A
Purchase Details
Closed on
Apr 29, 1997
Sold by
Brogan Debra
Bought by
Diehl Jeffrey T and Garrett April S
Create a Home Valuation Report for This Property
The Home Valuation Report is an in-depth analysis detailing your home's value as well as a comparison with similar homes in the area
Home Values in the Area
Average Home Value in this Area
Purchase History
| Date | Buyer | Sale Price | Title Company |
|---|---|---|---|
| Samuels Martin | -- | None Available | |
| Samuels Martin | -- | None Available | |
| Samuels Martin | -- | None Available | |
| Pioli Susan F | -- | -- | |
| Pioli Susan F | -- | -- | |
| Samuels Martin A | -- | -- | |
| Samuels Martin A | -- | -- | |
| Samuels Martin A | -- | -- | |
| Samuels Martin A | $600,000 | -- | |
| Samuels Martin A | $600,000 | -- | |
| Diehl Jeffrey T | $431,000 | -- | |
| Diehl Jeffrey T | $431,000 | -- |
Source: Public Records
Mortgage History
| Date | Status | Borrower | Loan Amount |
|---|---|---|---|
| Open | Samuels Martin | $510,400 | |
| Closed | Samuels Martin | $510,400 | |
| Previous Owner | Diehl Jeffrey T | $414,000 |
Source: Public Records
Tax History Compared to Growth
Tax History
| Year | Tax Paid | Tax Assessment Tax Assessment Total Assessment is a certain percentage of the fair market value that is determined by local assessors to be the total taxable value of land and additions on the property. | Land | Improvement |
|---|---|---|---|---|
| 2025 | $19,730 | $1,703,800 | $0 | $1,703,800 |
| 2024 | $17,938 | $1,645,700 | $0 | $1,645,700 |
| 2023 | $17,152 | $1,597,000 | $0 | $1,597,000 |
| 2022 | $16,548 | $1,521,000 | $0 | $1,521,000 |
| 2021 | $16,229 | $1,521,000 | $0 | $1,521,000 |
| 2020 | $15,985 | $1,513,700 | $0 | $1,513,700 |
| 2019 | $15,491 | $1,469,700 | $0 | $1,469,700 |
| 2018 | $14,532 | $1,386,600 | $0 | $1,386,600 |
| 2017 | $13,858 | $1,308,600 | $0 | $1,308,600 |
| 2016 | $13,841 | $1,258,300 | $0 | $1,258,300 |
| 2015 | $12,950 | $1,069,400 | $0 | $1,069,400 |
| 2014 | $12,347 | $981,500 | $0 | $981,500 |
Source: Public Records
Map
Nearby Homes
- 230-232 W Newton St Unit B
- 30 Cumberland St
- 231 W Newton St Unit 3
- 131 Saint Botolph St Unit 1
- 257 W Newton St
- 68 W Rutland Square
- 10 Cumberland St Unit 10-4
- 15 Blackwood St Unit 2
- 521 Columbus Ave Unit 4
- 15 Garrison St Unit 7
- 16 Holyoke St Unit 2
- 56 Rutland Square
- 100 Belvidere St Unit 7A
- 100 Belvidere St Unit 4G
- 9-17 Harcourt St Unit 503
- 128 Pembroke St Unit 2-3
- 41 Rutland Square Unit 1
- 1 Dalton St Unit 5102
- 1 Dalton St Unit 3801
- 1 Dalton St Unit 5503
- 3 Durham St Unit 4
- 3 Durham St
- 3 Durham St Unit 1
- 3 Durham St Unit 2
- 3 Durham St Unit 9
- 3 Durham St Unit 44
- 3 Durham St Unit 42
- 3 Durham St
- 3 Durham St Unit PH
- 3 Durham St
- 3 Durham St Unit 3
- 5 Durham St
- 5 Durham St Unit 4
- 5 Durham St Unit 3
- 5 Durham St Unit 2
- 5 Durham St Unit 1
- 5 Durham St Unit 9
- 5 Durham St Unit 8
- 5 Durham St Unit 6
- 5 Durham St Unit 7