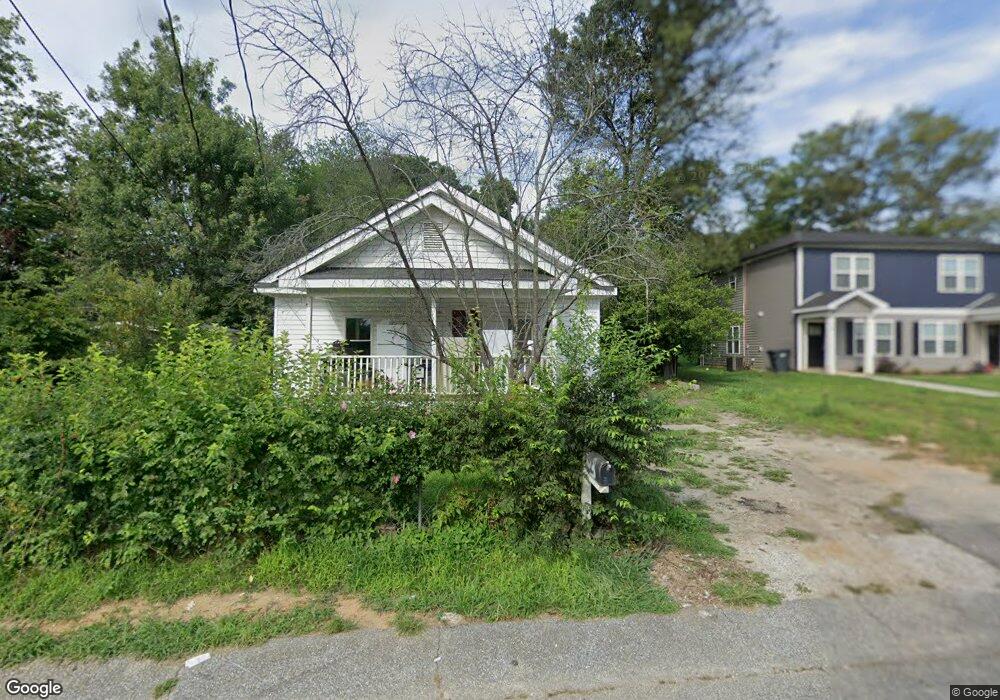
3 Dyer St Greenville, SC 29611
City View NeighborhoodEstimated Value: $101,000 - $154,000
2
Beds
1
Bath
960
Sq Ft
$137/Sq Ft
Est. Value
About This Home
This home is located at 3 Dyer St, Greenville, SC 29611 and is currently estimated at $131,742, approximately $137 per square foot. 3 Dyer St is a home located in Greenville County with nearby schools including Alexander Elementary School, Lakeview Middle, and Greenville Senior High School.
Ownership History
Date
Name
Owned For
Owner Type
Purchase Details
Closed on
Mar 18, 2021
Sold by
Zani Daniel
Bought by
Hoxhallari Nazije
Current Estimated Value
Purchase Details
Closed on
Mar 9, 2017
Sold by
Zani Nazmije
Bought by
Zani Daniel
Purchase Details
Closed on
Oct 20, 2016
Sold by
Yearwood Scott and Yearwood Jennifer
Bought by
Zani Nazmije
Purchase Details
Closed on
Oct 13, 2016
Sold by
Osteen Mary Elizabeth Link
Bought by
Yearwood Scott and Yearwood Jennifer
Purchase Details
Closed on
Feb 16, 2001
Sold by
Rimer Arvan S
Bought by
Yearwood Jennifer
Create a Home Valuation Report for This Property
The Home Valuation Report is an in-depth analysis detailing your home's value as well as a comparison with similar homes in the area
Home Values in the Area
Average Home Value in this Area
Purchase History
| Date | Buyer | Sale Price | Title Company |
|---|---|---|---|
| Hoxhallari Nazije | $43,200 | None Available | |
| Zani Daniel | -- | None Available | |
| Zani Nazmije | $12,000 | None Available | |
| Yearwood Scott | -- | None Available | |
| Yearwood Jennifer | $2,491 | -- |
Source: Public Records
Tax History Compared to Growth
Tax History
| Year | Tax Paid | Tax Assessment Tax Assessment Total Assessment is a certain percentage of the fair market value that is determined by local assessors to be the total taxable value of land and additions on the property. | Land | Improvement |
|---|---|---|---|---|
| 2024 | $1,211 | $2,470 | $840 | $1,630 |
| 2023 | $1,211 | $2,470 | $840 | $1,630 |
| 2022 | $1,174 | $2,470 | $840 | $1,630 |
| 2021 | $1,219 | $2,300 | $840 | $1,460 |
| 2020 | $1,277 | $2,300 | $840 | $1,460 |
| 2019 | $1,093 | $1,870 | $480 | $1,390 |
| 2018 | $975 | $1,870 | $480 | $1,390 |
| 2017 | $966 | $1,870 | $480 | $1,390 |
| 2016 | $925 | $31,090 | $8,000 | $23,090 |
| 2015 | $1,185 | $43,220 | $8,000 | $35,220 |
| 2014 | $1,134 | $41,085 | $8,317 | $32,768 |
Source: Public Records
Map
Nearby Homes