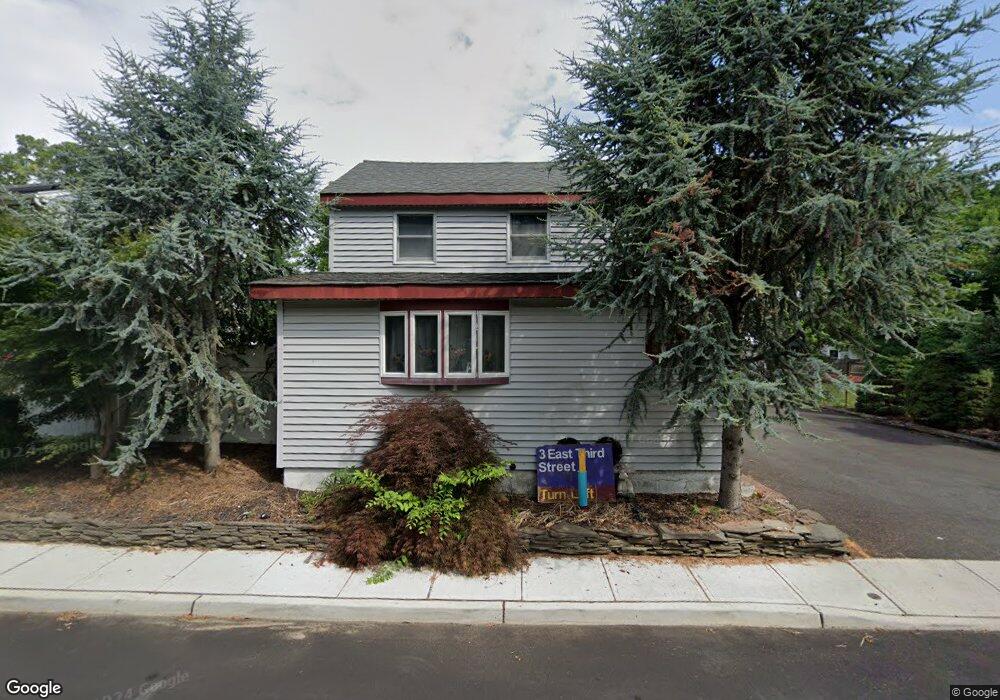
3 E 3rd St Keyport, NJ 07735
Estimated Value: $510,000 - $647,000
2
Beds
2
Baths
1,935
Sq Ft
$291/Sq Ft
Est. Value
About This Home
This home is located at 3 E 3rd St, Keyport, NJ 07735 and is currently estimated at $562,151, approximately $290 per square foot. 3 E 3rd St is a home located in Monmouth County with nearby schools including Keyport Central School, Keyport High School, and Icob Academy.
Ownership History
Date
Name
Owned For
Owner Type
Purchase Details
Closed on
Jan 5, 2002
Sold by
Thoney Dennis
Bought by
Mura Scott and Mura Janet
Current Estimated Value
Purchase Details
Closed on
Feb 15, 2001
Sold by
Thoney Dennis
Bought by
Mura Scott and Mura Janet
Home Financials for this Owner
Home Financials are based on the most recent Mortgage that was taken out on this home.
Original Mortgage
$141,876
Interest Rate
7%
Mortgage Type
FHA
Purchase Details
Closed on
Feb 29, 1996
Sold by
Caprio Nicholas
Bought by
Thoney Dennis
Home Financials for this Owner
Home Financials are based on the most recent Mortgage that was taken out on this home.
Original Mortgage
$109,000
Interest Rate
7%
Create a Home Valuation Report for This Property
The Home Valuation Report is an in-depth analysis detailing your home's value as well as a comparison with similar homes in the area
Home Values in the Area
Average Home Value in this Area
Purchase History
| Date | Buyer | Sale Price | Title Company |
|---|---|---|---|
| Mura Scott | $143,000 | -- | |
| Mura Scott | $143,000 | -- | |
| Thoney Dennis | $115,000 | -- |
Source: Public Records
Mortgage History
| Date | Status | Borrower | Loan Amount |
|---|---|---|---|
| Previous Owner | Mura Scott | $141,876 | |
| Previous Owner | Thoney Dennis | $109,000 |
Source: Public Records
Tax History
| Year | Tax Paid | Tax Assessment Tax Assessment Total Assessment is a certain percentage of the fair market value that is determined by local assessors to be the total taxable value of land and additions on the property. | Land | Improvement |
|---|---|---|---|---|
| 2025 | $8,653 | $471,100 | $201,400 | $269,700 |
| 2024 | $8,550 | $418,000 | $161,600 | $256,400 |
| 2023 | $8,550 | $389,000 | $146,900 | $242,100 |
| 2022 | $7,958 | $338,300 | $127,800 | $210,500 |
| 2021 | $7,958 | $315,300 | $111,100 | $204,200 |
| 2020 | $7,614 | $299,400 | $105,200 | $194,200 |
| 2019 | $7,719 | $304,000 | $101,700 | $202,300 |
| 2018 | $7,353 | $282,800 | $93,500 | $189,300 |
| 2017 | $7,393 | $283,600 | $96,700 | $186,900 |
| 2016 | $7,145 | $276,400 | $96,700 | $179,700 |
| 2015 | $6,986 | $269,000 | $91,700 | $177,300 |
| 2014 | $6,337 | $246,400 | $66,700 | $179,700 |
Source: Public Records
Map
Nearby Homes
Your Personal Tour Guide
Ask me questions while you tour the home.