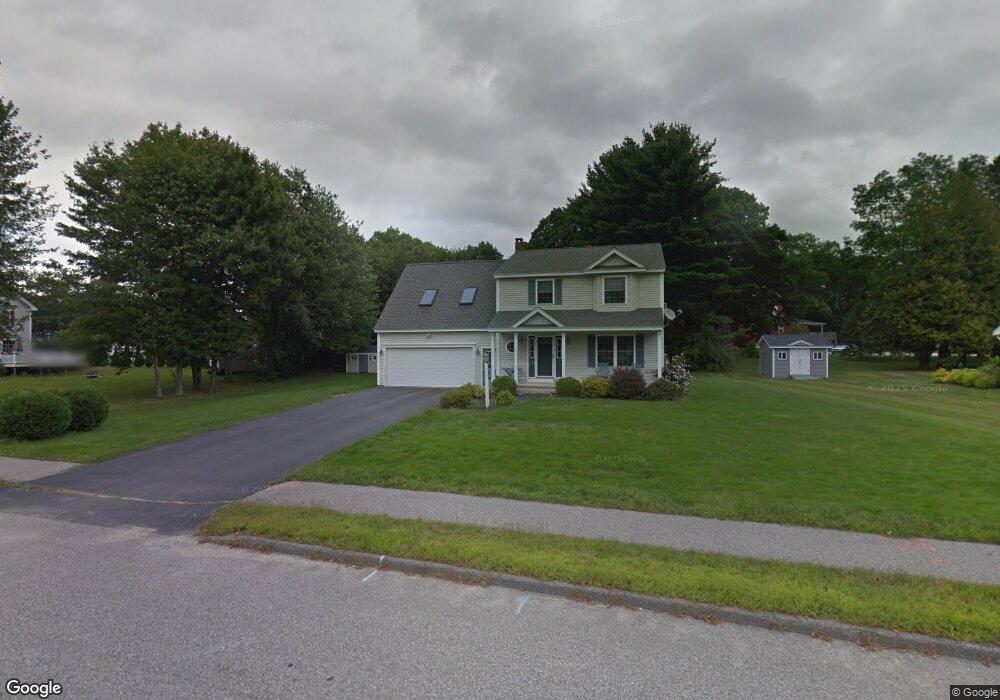
3 E Brook Ln Biddeford, ME 04005
Estimated Value: $605,000 - $637,000
3
Beds
2
Baths
2,397
Sq Ft
$260/Sq Ft
Est. Value
About This Home
This home is located at 3 E Brook Ln, Biddeford, ME 04005 and is currently estimated at $622,592, approximately $259 per square foot. 3 E Brook Ln is a home located in York County with nearby schools including John F Kennedy Memorial School, Biddeford Intermediate School, and Biddeford Primary School.
Ownership History
Date
Name
Owned For
Owner Type
Purchase Details
Closed on
Jan 3, 2018
Sold by
Provencher Kevin D and Provencher Diane D
Bought by
Fournier Joseph and Fournier Megan S
Current Estimated Value
Home Financials for this Owner
Home Financials are based on the most recent Mortgage that was taken out on this home.
Original Mortgage
$304,407
Outstanding Balance
$253,730
Interest Rate
3.92%
Mortgage Type
New Conventional
Estimated Equity
$368,862
Create a Home Valuation Report for This Property
The Home Valuation Report is an in-depth analysis detailing your home's value as well as a comparison with similar homes in the area
Home Values in the Area
Average Home Value in this Area
Purchase History
| Date | Buyer | Sale Price | Title Company |
|---|---|---|---|
| Fournier Joseph | -- | -- | |
| Fournier Joseph | -- | -- | |
| Fournier Joseph | -- | -- |
Source: Public Records
Mortgage History
| Date | Status | Borrower | Loan Amount |
|---|---|---|---|
| Open | Fournier Joseph | $304,407 | |
| Closed | Fournier Joseph | $304,407 | |
| Previous Owner | Fournier Joseph | $294,820 |
Source: Public Records
Tax History
| Year | Tax Paid | Tax Assessment Tax Assessment Total Assessment is a certain percentage of the fair market value that is determined by local assessors to be the total taxable value of land and additions on the property. | Land | Improvement |
|---|---|---|---|---|
| 2025 | $7,020 | $469,900 | $171,900 | $298,000 |
| 2024 | $6,652 | $467,800 | $171,900 | $295,900 |
| 2023 | $6,101 | $465,000 | $169,100 | $295,900 |
| 2022 | $6,008 | $366,100 | $97,200 | $268,900 |
| 2021 | $5,622 | $308,400 | $83,700 | $224,700 |
| 2020 | $5,588 | $278,700 | $73,700 | $205,000 |
| 2019 | $5,568 | $278,700 | $73,700 | $205,000 |
| 2018 | $5,490 | $278,700 | $73,700 | $205,000 |
| 2017 | $5,447 | $271,400 | $73,700 | $197,700 |
| 2016 | $5,390 | $271,400 | $73,700 | $197,700 |
| 2015 | $5,080 | $270,900 | $73,700 | $197,200 |
| 2014 | $4,954 | $270,900 | $73,700 | $197,200 |
| 2013 | -- | $295,700 | $79,900 | $215,800 |
Source: Public Records
Map
Nearby Homes
Your Personal Tour Guide
Ask me questions while you tour the home.