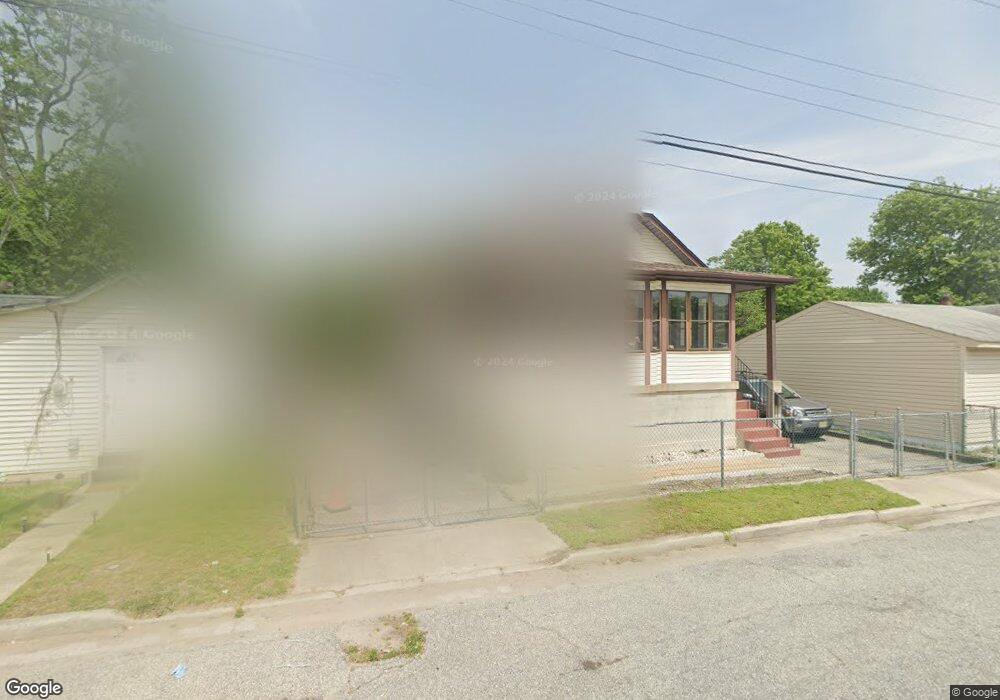
3 E Union St Penns Grove, NJ 08069
Estimated Value: $160,101 - $197,000
2
Beds
1
Bath
1,078
Sq Ft
$159/Sq Ft
Est. Value
About This Home
This home is located at 3 E Union St, Penns Grove, NJ 08069 and is currently estimated at $171,025, approximately $158 per square foot. 3 E Union St is a home located in Salem County with nearby schools including Lafayette-Pershing Elementary School, Field Street Elementary School, and Paul W. Carleton Elementary School.
Ownership History
Date
Name
Owned For
Owner Type
Purchase Details
Closed on
Feb 13, 2023
Sold by
Cunningham David
Bought by
Pure Focus Rental Solutions Llc
Current Estimated Value
Purchase Details
Closed on
Oct 27, 2017
Sold by
Miller Charles M
Bought by
Cunningham David
Purchase Details
Closed on
Nov 8, 2004
Sold by
Household Finance Corp Iii
Bought by
Clarke Veron A
Home Financials for this Owner
Home Financials are based on the most recent Mortgage that was taken out on this home.
Original Mortgage
$74,100
Interest Rate
5.63%
Mortgage Type
Purchase Money Mortgage
Purchase Details
Closed on
Jul 9, 2004
Sold by
Brown Winston and Brown Beatrice
Bought by
Household Finance Corp Iii
Home Financials for this Owner
Home Financials are based on the most recent Mortgage that was taken out on this home.
Original Mortgage
$2,964
Interest Rate
5.75%
Mortgage Type
Stand Alone Second
Create a Home Valuation Report for This Property
The Home Valuation Report is an in-depth analysis detailing your home's value as well as a comparison with similar homes in the area
Home Values in the Area
Average Home Value in this Area
Purchase History
| Date | Buyer | Sale Price | Title Company |
|---|---|---|---|
| Pure Focus Rental Solutions Llc | -- | -- | |
| Pure Focus Rental Solutions Llc | -- | None Listed On Document | |
| 3 East Union Llc | -- | -- | |
| 3 East Union Llc | -- | None Listed On Document | |
| Cunningham David | $25,100 | -- | |
| Clarke Veron A | $78,000 | -- | |
| Household Finance Corp Iii | $60,100 | Cumberland Title Agency Llc |
Source: Public Records
Mortgage History
| Date | Status | Borrower | Loan Amount |
|---|---|---|---|
| Previous Owner | Clarke Veron A | $74,100 | |
| Previous Owner | Household Finance Corp Iii | $2,964 |
Source: Public Records
Tax History Compared to Growth
Tax History
| Year | Tax Paid | Tax Assessment Tax Assessment Total Assessment is a certain percentage of the fair market value that is determined by local assessors to be the total taxable value of land and additions on the property. | Land | Improvement |
|---|---|---|---|---|
| 2025 | $4,764 | $85,900 | $12,900 | $73,000 |
| 2024 | $4,604 | $85,900 | $12,900 | $73,000 |
| 2023 | $4,604 | $85,900 | $12,900 | $73,000 |
| 2022 | $4,438 | $85,900 | $12,900 | $73,000 |
| 2021 | $4,211 | $85,900 | $12,900 | $73,000 |
| 2020 | $4,303 | $85,900 | $12,900 | $73,000 |
| 2019 | $4,321 | $85,900 | $12,900 | $73,000 |
| 2018 | $3,937 | $97,600 | $20,900 | $76,700 |
| 2017 | $3,951 | $97,600 | $20,900 | $76,700 |
| 2016 | $3,802 | $97,600 | $20,900 | $76,700 |
| 2015 | $3,641 | $97,600 | $20,900 | $76,700 |
| 2014 | $3,601 | $97,600 | $20,900 | $76,700 |
Source: Public Records
Map
Nearby Homes
- 113 N Broad St
- 59 61 Broad St
- 27 E Line St
- 31 Elvin Ave
- 18 Pearl St
- 6 W Griffith St
- 71 Poplar St
- 28 4th Ave
- 54 W Pitman St
- 136 Penns Grove Auburn Rd
- 99 N Virginia Ave
- 87 W Pitman St
- 35 Franklin St
- 78 W Harmony St
- 3 Naylor Ave
- 111 Grove St
- 51 Washington Ave
- 0 Cumberland Ave
- 89 Delaware Ave
- 81 7th Ave