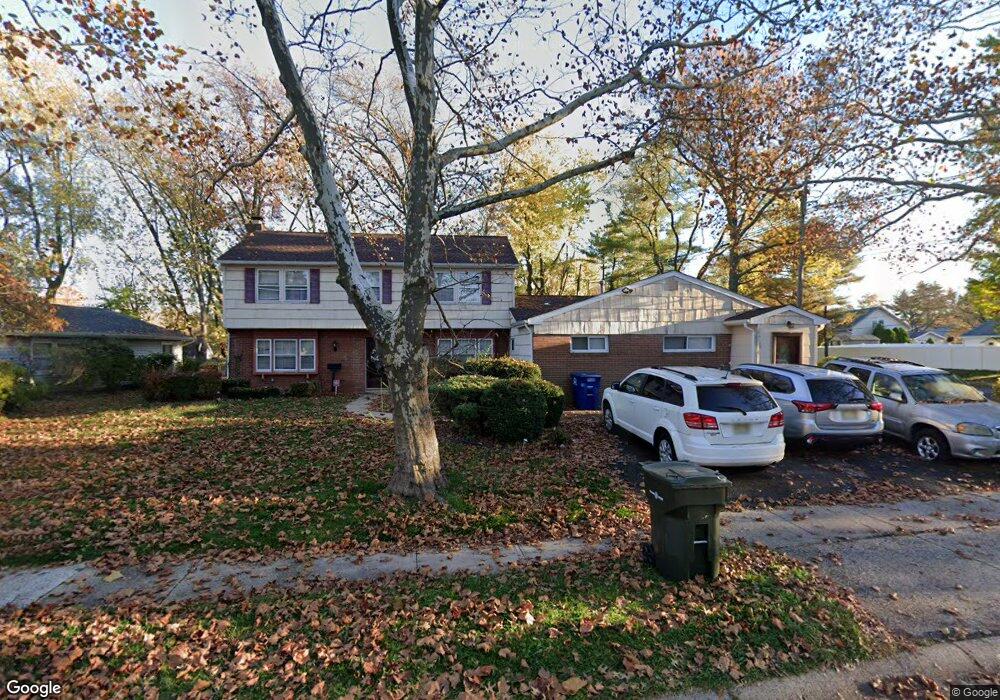
3 Eastbrook Ln Willingboro, NJ 08046
Estimated Value: $397,788 - $450,000
--
Bed
--
Bath
2,589
Sq Ft
$163/Sq Ft
Est. Value
About This Home
This home is located at 3 Eastbrook Ln, Willingboro, NJ 08046 and is currently estimated at $422,197, approximately $163 per square foot. 3 Eastbrook Ln is a home located in Burlington County with nearby schools including Hawthorne Park Elementary School, Memorial Middle School, and Levitt Intermediate School.
Ownership History
Date
Name
Owned For
Owner Type
Purchase Details
Closed on
Mar 21, 2003
Sold by
Dimerson George and Dimerson Roselyn
Bought by
Dimerson Roselyn
Current Estimated Value
Purchase Details
Closed on
May 29, 2001
Sold by
Litwack Ronald Irwin and Litwack Elaine
Bought by
Dimerson George and Dimerson Roselyn
Home Financials for this Owner
Home Financials are based on the most recent Mortgage that was taken out on this home.
Original Mortgage
$112,200
Interest Rate
6.71%
Mortgage Type
Balloon
Create a Home Valuation Report for This Property
The Home Valuation Report is an in-depth analysis detailing your home's value as well as a comparison with similar homes in the area
Home Values in the Area
Average Home Value in this Area
Purchase History
| Date | Buyer | Sale Price | Title Company |
|---|---|---|---|
| Dimerson Roselyn | -- | -- | |
| Dimerson George | $131,999 | Executive Title & Abstract I |
Source: Public Records
Mortgage History
| Date | Status | Borrower | Loan Amount |
|---|---|---|---|
| Previous Owner | Dimerson George | $112,200 |
Source: Public Records
Tax History Compared to Growth
Tax History
| Year | Tax Paid | Tax Assessment Tax Assessment Total Assessment is a certain percentage of the fair market value that is determined by local assessors to be the total taxable value of land and additions on the property. | Land | Improvement |
|---|---|---|---|---|
| 2025 | $7,986 | $185,000 | $44,900 | $140,100 |
| 2024 | $7,927 | $185,000 | $44,900 | $140,100 |
| 2023 | $7,927 | $185,000 | $44,900 | $140,100 |
| 2022 | $7,380 | $185,000 | $44,900 | $140,100 |
| 2021 | $7,393 | $185,000 | $44,900 | $140,100 |
| 2020 | $7,424 | $185,000 | $44,900 | $140,100 |
| 2019 | $9,397 | $236,400 | $44,900 | $191,500 |
| 2018 | $9,222 | $236,400 | $44,900 | $191,500 |
| 2017 | $8,964 | $236,400 | $44,900 | $191,500 |
| 2016 | $8,874 | $236,400 | $44,900 | $191,500 |
| 2015 | $8,570 | $236,400 | $44,900 | $191,500 |
| 2014 | $8,158 | $236,400 | $44,900 | $191,500 |
Source: Public Records
Map
Nearby Homes