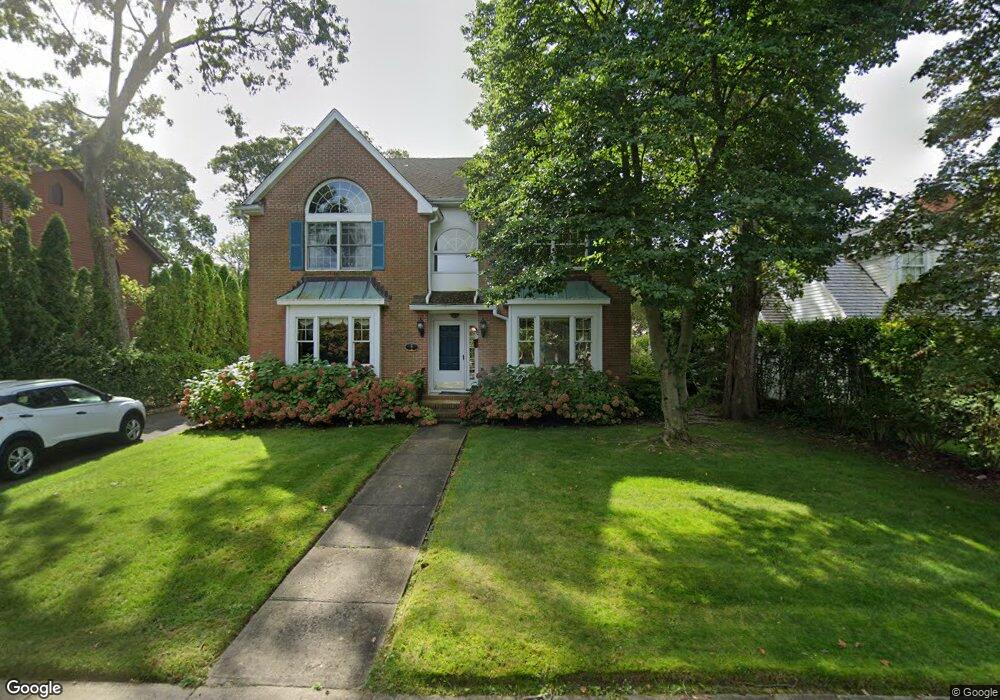
3 Elizabeth Ct Spring Lake, NJ 07762
Estimated Value: $3,256,000 - $4,122,236
5
Beds
3
Baths
3,600
Sq Ft
$997/Sq Ft
Est. Value
About This Home
This home is located at 3 Elizabeth Ct, Spring Lake, NJ 07762 and is currently estimated at $3,587,809, approximately $996 per square foot. 3 Elizabeth Ct is a home located in Monmouth County with nearby schools including St. Catharine School and St Rose High School.
Ownership History
Date
Name
Owned For
Owner Type
Purchase Details
Closed on
Dec 14, 2007
Sold by
Fittin Christopher and Fittin Susan E
Bought by
Fittin Susan E
Current Estimated Value
Home Financials for this Owner
Home Financials are based on the most recent Mortgage that was taken out on this home.
Original Mortgage
$126,138
Outstanding Balance
$79,716
Interest Rate
6.27%
Mortgage Type
Purchase Money Mortgage
Estimated Equity
$3,508,093
Purchase Details
Closed on
Jun 16, 1999
Sold by
Marasco Robert
Bought by
Fittin Christopher and Fittin Susan
Create a Home Valuation Report for This Property
The Home Valuation Report is an in-depth analysis detailing your home's value as well as a comparison with similar homes in the area
Home Values in the Area
Average Home Value in this Area
Purchase History
| Date | Buyer | Sale Price | Title Company |
|---|---|---|---|
| Fittin Susan E | -- | None Available | |
| Fittin Christopher | $402,500 | -- |
Source: Public Records
Mortgage History
| Date | Status | Borrower | Loan Amount |
|---|---|---|---|
| Open | Fittin Susan E | $126,138 |
Source: Public Records
Tax History Compared to Growth
Tax History
| Year | Tax Paid | Tax Assessment Tax Assessment Total Assessment is a certain percentage of the fair market value that is determined by local assessors to be the total taxable value of land and additions on the property. | Land | Improvement |
|---|---|---|---|---|
| 2025 | $12,279 | $2,879,700 | $2,062,200 | $817,500 |
| 2024 | $11,710 | $2,511,100 | $1,683,900 | $827,200 |
| 2023 | $11,710 | $2,328,000 | $1,520,100 | $807,900 |
| 2022 | $10,765 | $2,176,700 | $1,407,500 | $769,200 |
| 2021 | $10,765 | $1,794,100 | $1,098,300 | $695,800 |
| 2020 | $10,754 | $1,740,100 | $1,071,400 | $668,700 |
| 2019 | $10,653 | $1,691,000 | $1,041,600 | $649,400 |
| 2018 | $10,849 | $1,727,500 | $1,041,600 | $685,900 |
| 2017 | $10,579 | $1,689,900 | $1,041,600 | $648,300 |
| 2016 | $10,050 | $1,471,400 | $866,800 | $604,600 |
| 2015 | $10,119 | $1,449,700 | $845,100 | $604,600 |
| 2014 | $9,762 | $1,423,000 | $818,400 | $604,600 |
Source: Public Records
Map
Nearby Homes
- 1905 3rd Ave
- 737 20th Ave
- 1825 Pine Terrace
- 1813 Margerum Ave
- 15 Wyckham Rd
- 12 Wyckham Rd
- 1027 2nd Ave
- 708 18th Ave
- 1807-1809 Laurel Terrace
- 1800-1802 Pine Terrace
- 620 Redmond Ave
- 204 19th Ave
- 1730 Newman St
- 1803 Surf Ave
- 615 17th Ave
- 905 Wall Rd
- 107 18th Ave
- 118 Warren Ave
- 1012 Glenn St
- 200 17th Ave