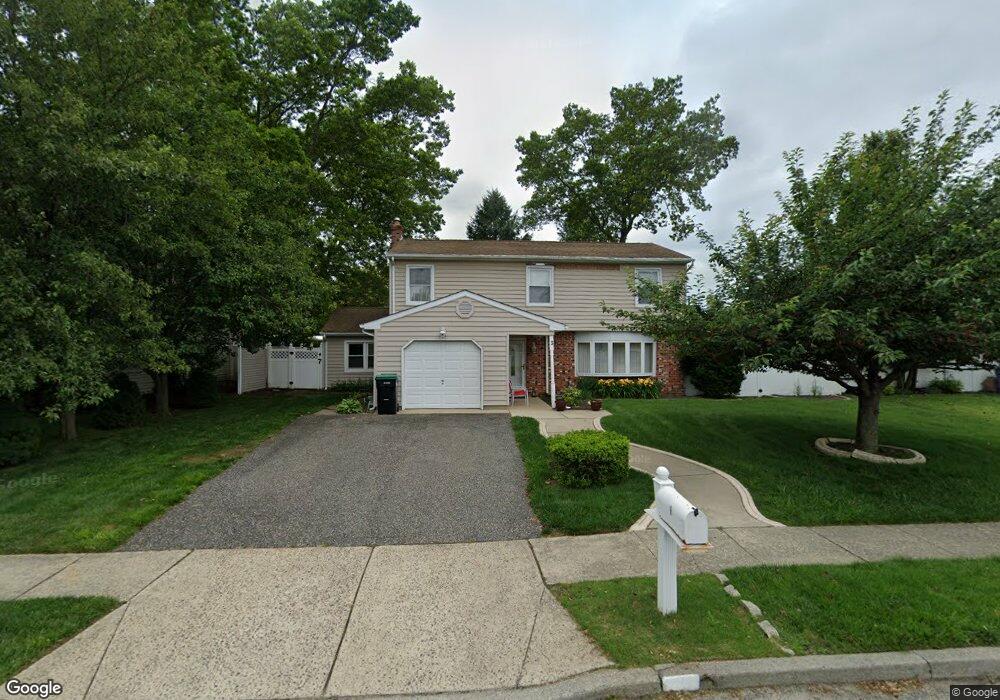
3 Emory St Howell, NJ 07731
Ramtown NeighborhoodEstimated Value: $640,572 - $683,000
4
Beds
2
Baths
1,949
Sq Ft
$340/Sq Ft
Est. Value
About This Home
This home is located at 3 Emory St, Howell, NJ 07731 and is currently estimated at $663,393, approximately $340 per square foot. 3 Emory St is a home located in Monmouth County with nearby schools including Ramtown School, Greenville School, and Howell Township Middle School South.
Ownership History
Date
Name
Owned For
Owner Type
Purchase Details
Closed on
Jul 26, 2022
Sold by
Almanza Joseph A
Bought by
Almanza Joseph A
Current Estimated Value
Purchase Details
Closed on
Jun 30, 1999
Sold by
Bathmann Robert
Bought by
Almanza Joseph and Almanza Julie
Home Financials for this Owner
Home Financials are based on the most recent Mortgage that was taken out on this home.
Original Mortgage
$182,050
Interest Rate
7.61%
Mortgage Type
VA
Create a Home Valuation Report for This Property
The Home Valuation Report is an in-depth analysis detailing your home's value as well as a comparison with similar homes in the area
Home Values in the Area
Average Home Value in this Area
Purchase History
| Date | Buyer | Sale Price | Title Company |
|---|---|---|---|
| Almanza Joseph A | -- | Calante Francine J | |
| Almanza Joseph A | -- | Calante Francine J | |
| Almanza Joseph | $178,500 | -- |
Source: Public Records
Mortgage History
| Date | Status | Borrower | Loan Amount |
|---|---|---|---|
| Previous Owner | Almanza Joseph | $182,050 |
Source: Public Records
Tax History
| Year | Tax Paid | Tax Assessment Tax Assessment Total Assessment is a certain percentage of the fair market value that is determined by local assessors to be the total taxable value of land and additions on the property. | Land | Improvement |
|---|---|---|---|---|
| 2025 | $9,307 | $575,100 | $328,400 | $246,700 |
| 2024 | $9,386 | $525,500 | $283,400 | $242,100 |
Source: Public Records
Map
Nearby Homes
- 28 Jacob Dr
- 40 Pinyon St
- 9 Ivy Place
- 18 Rutgers Dr
- 4 Pine Cone Ln
- 174 Ramtown Greenville Rd
- 24 Little Leaf Ln
- 39 Oak Terrace
- 19 Virginia Dr
- 457 Newtons Corner Rd
- 51 Alan Terrace
- 60 Sunset Dr
- 1150 Rita Ct
- 35 Vivian Ct
- 39 Virginia Dr
- 2 Higgins Ct
- 38 Amy Ct Unit 1301
- 131 Briar Mills Dr
- 902 Pioneer Dr
- 538 Linda Ct
Your Personal Tour Guide
Ask me questions while you tour the home.