Estimated Value: $772,249 - $979,000
4
Beds
4
Baths
4,308
Sq Ft
$211/Sq Ft
Est. Value
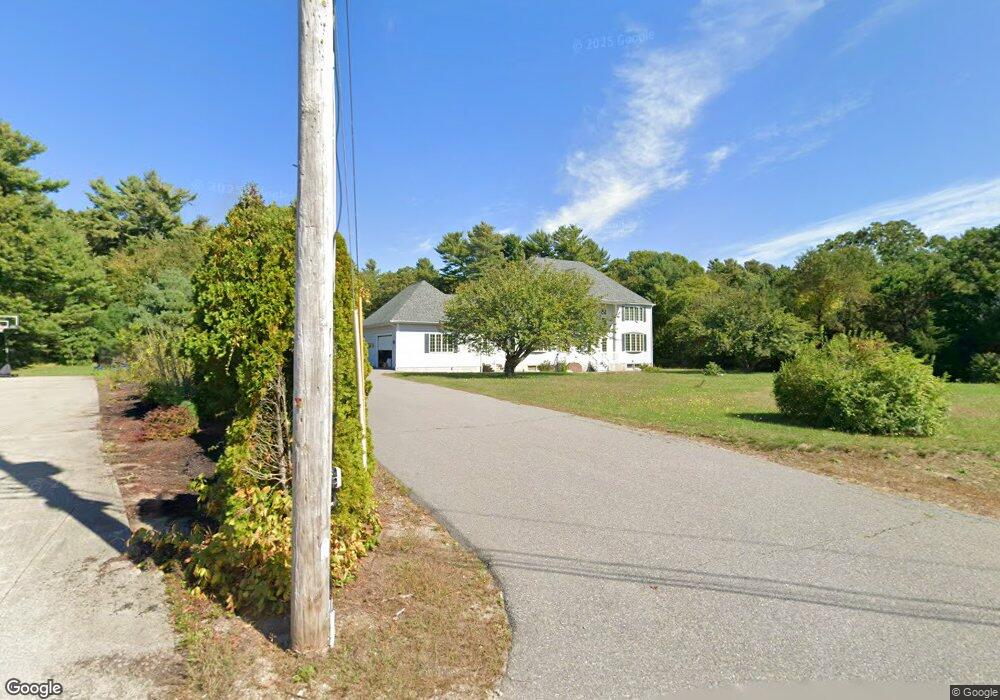
About This Home
This home is located at 3 Eric Dr, Berkley, MA 02779 and is currently estimated at $907,562, approximately $210 per square foot. 3 Eric Dr is a home located in Bristol County with nearby schools including Berkley Community School.
Ownership History
Date
Name
Owned For
Owner Type
Purchase Details
Closed on
Jun 18, 2021
Sold by
Nenopoulos Armandina P and Nenopoulos John P
Bought by
Santos Pedro and Santos Armanda P
Current Estimated Value
Home Financials for this Owner
Home Financials are based on the most recent Mortgage that was taken out on this home.
Original Mortgage
$414,000
Outstanding Balance
$373,189
Interest Rate
2.9%
Mortgage Type
Purchase Money Mortgage
Estimated Equity
$534,373
Purchase Details
Closed on
Oct 25, 2012
Sold by
Santos Alberto P and Santos Elisa M
Bought by
Nenopoulos Amandina P
Home Financials for this Owner
Home Financials are based on the most recent Mortgage that was taken out on this home.
Original Mortgage
$133,000
Interest Rate
3.56%
Mortgage Type
New Conventional
Create a Home Valuation Report for This Property
The Home Valuation Report is an in-depth analysis detailing your home's value as well as a comparison with similar homes in the area
Home Values in the Area
Average Home Value in this Area
Purchase History
| Date | Buyer | Sale Price | Title Company |
|---|---|---|---|
| Santos Pedro | $600,000 | None Available | |
| Nenopoulos Amandina P | -- | -- |
Source: Public Records
Mortgage History
| Date | Status | Borrower | Loan Amount |
|---|---|---|---|
| Open | Santos Pedro | $414,000 | |
| Previous Owner | Nenopoulos Amandina P | $133,000 |
Source: Public Records
Tax History
| Year | Tax Paid | Tax Assessment Tax Assessment Total Assessment is a certain percentage of the fair market value that is determined by local assessors to be the total taxable value of land and additions on the property. | Land | Improvement |
|---|---|---|---|---|
| 2025 | $9,991 | $831,900 | $128,600 | $703,300 |
| 2024 | $9,813 | $788,200 | $112,100 | $676,100 |
| 2023 | $9,027 | $682,800 | $112,100 | $570,700 |
| 2022 | $9,060 | $658,900 | $107,900 | $551,000 |
| 2021 | $9,135 | $639,700 | $103,300 | $536,400 |
| 2020 | $9,012 | $620,200 | $92,900 | $527,300 |
| 2019 | $8,695 | $593,900 | $92,900 | $501,000 |
| 2018 | $7,879 | $562,000 | $89,800 | $472,200 |
| 2017 | $7,412 | $518,300 | $99,100 | $419,200 |
| 2016 | $7,042 | $474,500 | $99,100 | $375,400 |
| 2015 | $6,609 | $475,100 | $99,100 | $376,000 |
| 2014 | $6,236 | $486,800 | $106,500 | $380,300 |
Source: Public Records
Map
Nearby Homes
- 66 S Main St
- 73 Bayview Ave
- 2 Bc Ln
- 2 Lima Ln
- LOT 2A Hudson Dr Unit 2A
- 10 W Cudworth Ave
- 1889 Elm St
- 73 Seymour St
- 35 Water St
- 23 Elmwood Dr
- 0 Sammys Ln
- 0 Anthony St
- 16 Water St Unit C
- 16 Water St Unit A
- 16 Water St Unit B
- 16 Water St Unit D
- 5 Hadley Heights Way
- 418 Hart St
- 7 Maris Ln
- 1524 Somerset Ave
Your Personal Tour Guide
Ask me questions while you tour the home.