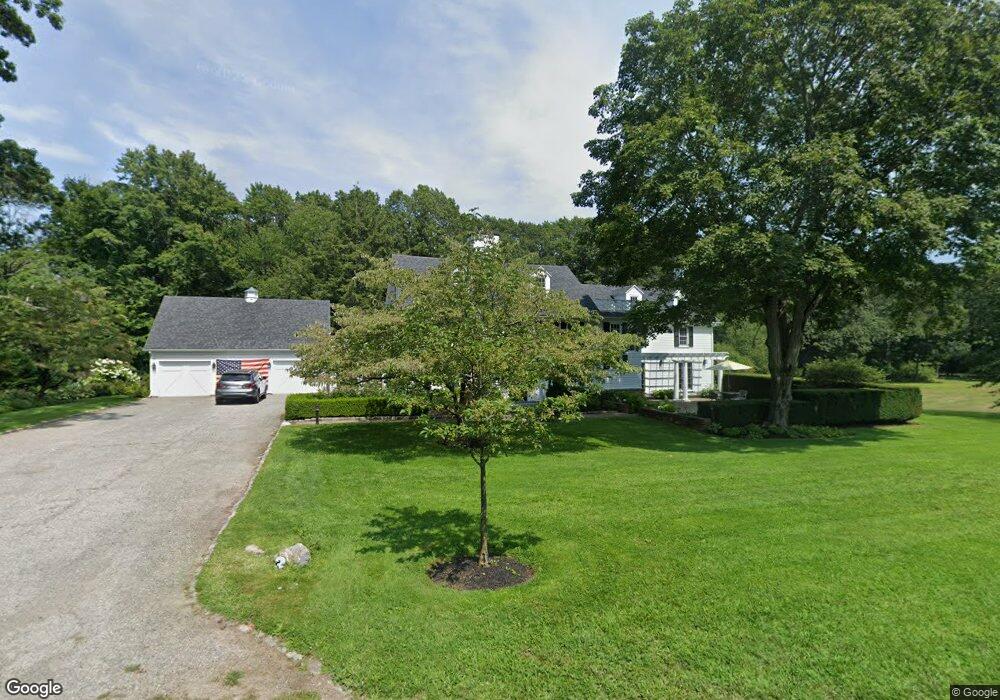
3 Erins Way South Hamilton, MA 01982
Estimated Value: $2,302,217 - $2,920,000
4
Beds
4
Baths
5,256
Sq Ft
$499/Sq Ft
Est. Value
About This Home
This home is located at 3 Erins Way, South Hamilton, MA 01982 and is currently estimated at $2,620,554, approximately $498 per square foot. 3 Erins Way is a home located in Essex County with nearby schools including Winthrop School, Cutler Elementary School, and Bessie Buker Elementary School.
Ownership History
Date
Name
Owned For
Owner Type
Purchase Details
Closed on
Feb 8, 2023
Sold by
Webber Joshua A and Webber Gaye E
Bought by
Gaye E Webber T
Current Estimated Value
Purchase Details
Closed on
Dec 3, 2007
Sold by
Johnston Robert F
Bought by
Webber Gaye E and Webber Joshua A
Create a Home Valuation Report for This Property
The Home Valuation Report is an in-depth analysis detailing your home's value as well as a comparison with similar homes in the area
Home Values in the Area
Average Home Value in this Area
Purchase History
| Date | Buyer | Sale Price | Title Company |
|---|---|---|---|
| Gaye E Webber T | -- | None Available | |
| Webber Gaye E | $1,300,000 | -- | |
| Webber Gaye E | $1,300,000 | -- |
Source: Public Records
Tax History Compared to Growth
Tax History
| Year | Tax Paid | Tax Assessment Tax Assessment Total Assessment is a certain percentage of the fair market value that is determined by local assessors to be the total taxable value of land and additions on the property. | Land | Improvement |
|---|---|---|---|---|
| 2025 | $32,242 | $2,060,200 | $735,400 | $1,324,800 |
| 2024 | $30,728 | $2,033,600 | $735,400 | $1,298,200 |
| 2023 | $31,445 | $1,924,400 | $673,100 | $1,251,300 |
| 2022 | $33,328 | $1,864,000 | $643,500 | $1,220,500 |
| 2021 | $32,639 | $1,864,000 | $643,500 | $1,220,500 |
| 2020 | $31,651 | $1,864,000 | $643,500 | $1,220,500 |
| 2019 | $30,074 | $1,824,900 | $625,700 | $1,199,200 |
| 2018 | $28,359 | $1,748,400 | $590,700 | $1,157,700 |
| 2017 | $27,555 | $1,639,200 | $554,500 | $1,084,700 |
| 2016 | $24,076 | $1,395,700 | $511,400 | $884,300 |
| 2015 | $22,813 | $1,334,900 | $489,600 | $845,300 |
| 2014 | $22,086 | $1,269,300 | $503,300 | $766,000 |
Source: Public Records
Map
Nearby Homes
- 946 Bay Rd Unit 2
- 968 Bay Rd
- 0 Meyer Ln
- 30 Autumn Ln
- 150 Sagamore St
- Zero Bridge Street Lot Eight
- 22 Sagamore Rd
- 41 Fellows Rd
- 173 Miles River Rd
- 6 Sagamore Rd
- 88 Maple St
- 42 Maple St
- 60 Lakemans Ln
- 34 Knowlton St
- 89 Choate St
- 99 Essex St
- 350 Essex St
- 17 Canter Brook Ln Unit 17
- 23 Lincoln Ave
- NHN Hamilton Heights