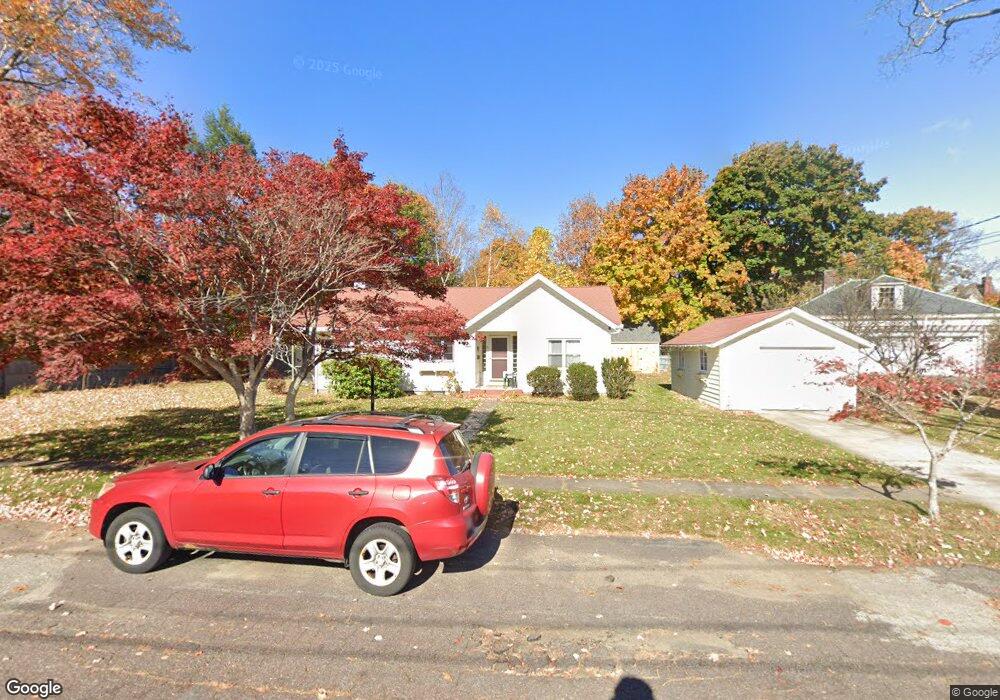
3 Estes St Amesbury, MA 01913
Estimated Value: $573,000 - $661,000
3
Beds
2
Baths
1,550
Sq Ft
$396/Sq Ft
Est. Value
About This Home
This home is located at 3 Estes St, Amesbury, MA 01913 and is currently estimated at $614,229, approximately $396 per square foot. 3 Estes St is a home located in Essex County with nearby schools including Amesbury High School and Amesbury Seventh-Day Adventist School.
Ownership History
Date
Name
Owned For
Owner Type
Purchase Details
Closed on
Apr 29, 2022
Sold by
Iacobucci Rt and Iacobucci
Bought by
Iacobucci J Peter
Current Estimated Value
Home Financials for this Owner
Home Financials are based on the most recent Mortgage that was taken out on this home.
Original Mortgage
$209,000
Outstanding Balance
$195,116
Interest Rate
4.16%
Mortgage Type
Purchase Money Mortgage
Estimated Equity
$419,113
Purchase Details
Closed on
Jan 19, 2016
Sold by
Estes Street Amesbury and Estes Iacobucci
Bought by
Iacobucci Ret and Iacobucci
Purchase Details
Closed on
May 16, 2012
Sold by
Jacobucci John J and Lacobucci Ann J
Bought by
Estes Street Amesbury and Estes Lacobucci
Purchase Details
Closed on
Jan 11, 1999
Sold by
Rie John E
Bought by
Iacobucci John J
Create a Home Valuation Report for This Property
The Home Valuation Report is an in-depth analysis detailing your home's value as well as a comparison with similar homes in the area
Home Values in the Area
Average Home Value in this Area
Purchase History
| Date | Buyer | Sale Price | Title Company |
|---|---|---|---|
| Iacobucci J Peter | $300,000 | None Available | |
| Iacobucci Ret | -- | -- | |
| Estes Street Amesbury | -- | -- | |
| Estes Street Amesbury | -- | -- | |
| Iacobucci John J | $163,000 | -- | |
| Iacobucci John J | $163,000 | -- |
Source: Public Records
Mortgage History
| Date | Status | Borrower | Loan Amount |
|---|---|---|---|
| Open | Iacobucci J Peter | $209,000 |
Source: Public Records
Tax History
| Year | Tax Paid | Tax Assessment Tax Assessment Total Assessment is a certain percentage of the fair market value that is determined by local assessors to be the total taxable value of land and additions on the property. | Land | Improvement |
|---|---|---|---|---|
| 2025 | $8,377 | $547,500 | $275,500 | $272,000 |
| 2024 | $7,926 | $506,800 | $259,900 | $246,900 |
| 2023 | $7,726 | $472,800 | $225,900 | $246,900 |
| 2022 | $7,478 | $422,700 | $196,500 | $226,200 |
| 2021 | $7,170 | $392,900 | $157,900 | $235,000 |
| 2020 | $6,458 | $375,900 | $151,900 | $224,000 |
| 2019 | $6,413 | $349,100 | $151,900 | $197,200 |
| 2018 | $6,576 | $346,300 | $144,600 | $201,700 |
| 2017 | $6,194 | $310,500 | $144,600 | $165,900 |
| 2016 | $6,072 | $299,400 | $144,600 | $154,800 |
| 2015 | $5,901 | $287,300 | $144,600 | $142,700 |
| 2014 | $5,421 | $258,500 | $144,600 | $113,900 |
Source: Public Records
Map
Nearby Homes
- 1 Hillside Ave Unit 3
- 4 Greenwood St
- 37 Lombard Ave
- 21 River St
- 35 Orchard St
- 4 Clark St
- 48 Orchard St
- 37 Powow St
- 97 Elm St
- 47 Cutter Ln Unit 47
- 25 Cedar St Unit 7
- 101 Market St Unit B
- 105 Market St Unit B
- 19 Cutter Ln Unit 19
- 382 Main St
- 60 Merrimac St Unit 504
- 204 Elm St
- 149 Market St
- 4 Spindle Tree Ln
- 3 Birchwood Point Unit 202
- 3 Estes St
- 3 Estes St Unit 3
- 5 Estes St
- 5 Hillside Ave
- 7 Hillside Ave
- 3 Hillside Ave
- 4 Estes St
- 9 Hillside Ave
- 63 Highland St
- 65 Highland St
- 6 Estes St
- 1 Hillside Ave Unit 4
- 1 Hillside Ave Unit 2
- 1 Hillside Ave
- 1 Hillside Ave Unit B
- 1 Hillside Ave Unit 1
- 13 Hillside Ave
- 6A Estes St
- 6 Hillside Ave
- 61 Highland St
Your Personal Tour Guide
Ask me questions while you tour the home.