Estimated Value: $164,000 - $186,173
4
Beds
1
Bath
3,000
Sq Ft
$60/Sq Ft
Est. Value
About This Home
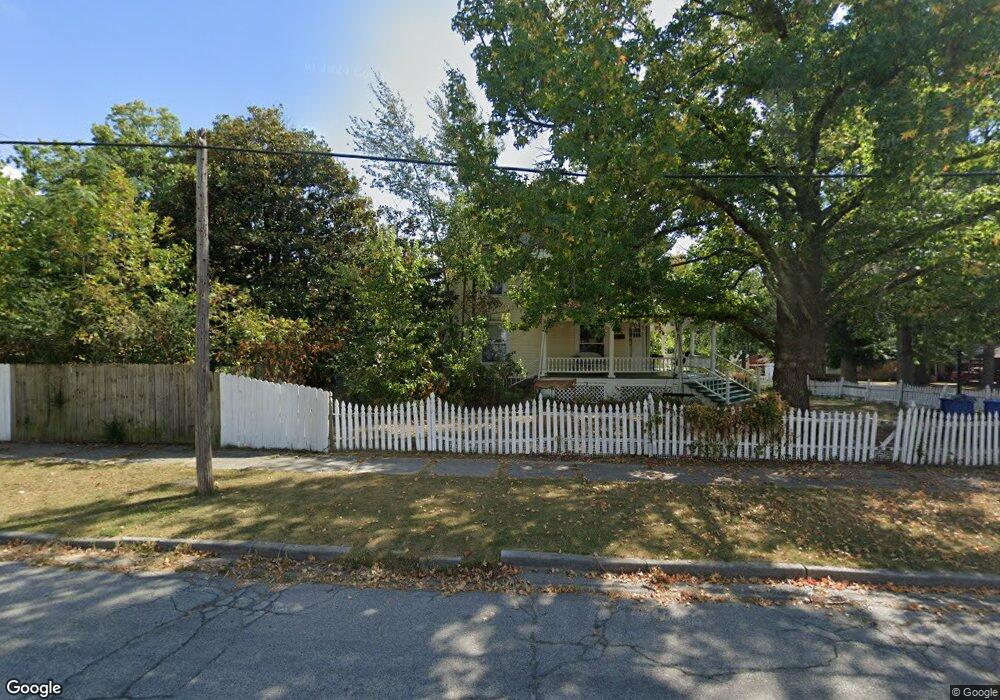
This home is located at 3 F St SW, Miami, OK 74354 and is currently estimated at $179,043, approximately $59 per square foot. 3 F St SW is a home located in Ottawa County with nearby schools including Miami High School and Mt. Olive Lutheran School.
Ownership History
Date
Name
Owned For
Owner Type
Purchase Details
Closed on
Sep 7, 2007
Sold by
Laur Patricia J
Bought by
Carnahan Donald and Carnahan Margaret
Current Estimated Value
Home Financials for this Owner
Home Financials are based on the most recent Mortgage that was taken out on this home.
Original Mortgage
$129,240
Outstanding Balance
$81,703
Interest Rate
6.63%
Mortgage Type
New Conventional
Estimated Equity
$97,340
Purchase Details
Closed on
Sep 29, 1999
Bought by
Laub Patricia J
Purchase Details
Closed on
Aug 17, 1992
Bought by
Karen Rod and Karen Plott
Create a Home Valuation Report for This Property
The Home Valuation Report is an in-depth analysis detailing your home's value as well as a comparison with similar homes in the area
Home Values in the Area
Average Home Value in this Area
Purchase History
| Date | Buyer | Sale Price | Title Company |
|---|---|---|---|
| Carnahan Donald | $144,000 | None Available | |
| Laub Patricia J | $131,000 | -- | |
| Karen Rod | $29,000 | -- |
Source: Public Records
Mortgage History
| Date | Status | Borrower | Loan Amount |
|---|---|---|---|
| Open | Carnahan Donald | $129,240 |
Source: Public Records
Tax History Compared to Growth
Tax History
| Year | Tax Paid | Tax Assessment Tax Assessment Total Assessment is a certain percentage of the fair market value that is determined by local assessors to be the total taxable value of land and additions on the property. | Land | Improvement |
|---|---|---|---|---|
| 2025 | $1,915 | $18,422 | $524 | $17,898 |
| 2024 | $1,915 | $20,869 | $524 | $20,345 |
| 2023 | $1,915 | $21,319 | $855 | $20,464 |
| 2022 | $1,845 | $20,957 | $855 | $20,102 |
| 2021 | $1,828 | $20,346 | $855 | $19,491 |
| 2020 | $1,787 | $19,754 | $855 | $18,899 |
| 2019 | $1,493 | $19,179 | $855 | $18,324 |
| 2018 | $1,473 | $18,827 | $855 | $17,972 |
| 2017 | $1,452 | $18,279 | $855 | $17,424 |
| 2016 | $1,345 | $17,747 | $881 | $16,866 |
| 2015 | $1,327 | $14,934 | $610 | $14,324 |
| 2014 | $1,372 | $17,747 | $881 | $16,866 |
Source: Public Records
Map
Nearby Homes