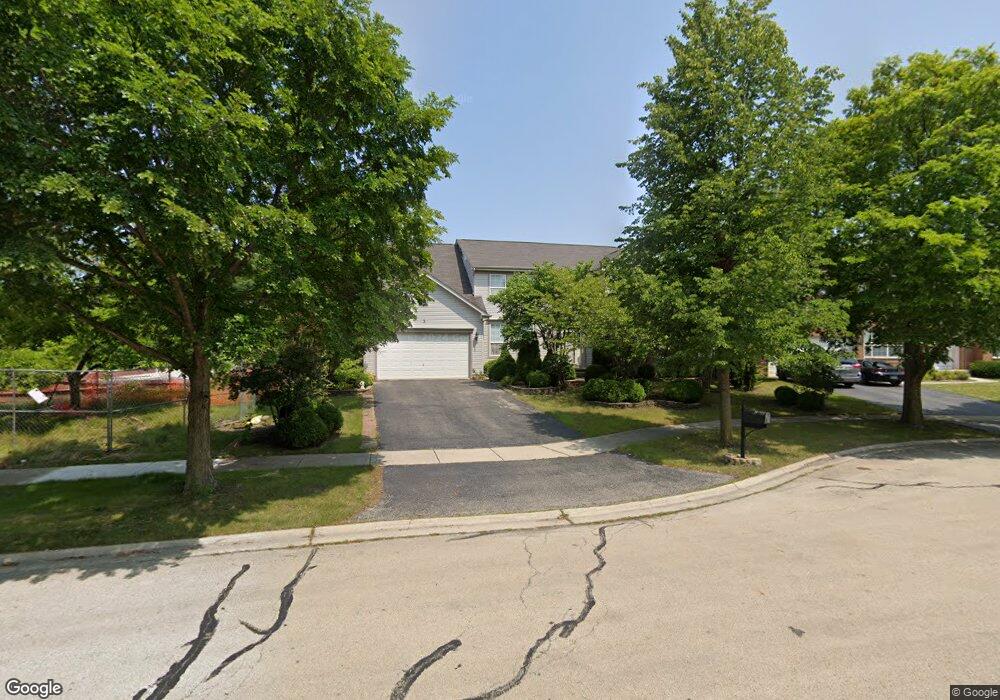
3 Fairfax Ct Bolingbrook, IL 60490
West Bolingbrook NeighborhoodEstimated Value: $496,682 - $637,000
--
Bed
1
Bath
2,840
Sq Ft
$197/Sq Ft
Est. Value
About This Home
This home is located at 3 Fairfax Ct, Bolingbrook, IL 60490 and is currently estimated at $559,171, approximately $196 per square foot. 3 Fairfax Ct is a home located in Will County with nearby schools including Liberty Elementary School, John F Kennedy Middle School, and Plainfield East High School.
Ownership History
Date
Name
Owned For
Owner Type
Purchase Details
Closed on
Mar 28, 2005
Sold by
Bolingbrook Lp
Bought by
Carpio Marco A and Carpio Lilian S
Current Estimated Value
Home Financials for this Owner
Home Financials are based on the most recent Mortgage that was taken out on this home.
Original Mortgage
$255,774
Outstanding Balance
$134,296
Interest Rate
6.05%
Mortgage Type
Fannie Mae Freddie Mac
Estimated Equity
$424,875
Create a Home Valuation Report for This Property
The Home Valuation Report is an in-depth analysis detailing your home's value as well as a comparison with similar homes in the area
Home Values in the Area
Average Home Value in this Area
Purchase History
| Date | Buyer | Sale Price | Title Company |
|---|---|---|---|
| Carpio Marco A | $319,000 | Stewart Title Company |
Source: Public Records
Mortgage History
| Date | Status | Borrower | Loan Amount |
|---|---|---|---|
| Open | Carpio Marco A | $255,774 |
Source: Public Records
Tax History Compared to Growth
Tax History
| Year | Tax Paid | Tax Assessment Tax Assessment Total Assessment is a certain percentage of the fair market value that is determined by local assessors to be the total taxable value of land and additions on the property. | Land | Improvement |
|---|---|---|---|---|
| 2024 | $10,253 | $152,991 | $41,067 | $111,924 |
| 2023 | $10,253 | $135,151 | $36,278 | $98,873 |
| 2022 | $8,647 | $117,363 | $34,318 | $83,045 |
| 2021 | $8,313 | $111,774 | $32,684 | $79,090 |
| 2020 | $8,289 | $110,003 | $32,166 | $77,837 |
| 2019 | $8,254 | $106,902 | $31,259 | $75,643 |
| 2018 | $7,928 | $101,188 | $30,571 | $70,617 |
| 2017 | $7,949 | $98,576 | $29,782 | $68,794 |
| 2016 | $8,084 | $96,454 | $29,141 | $67,313 |
| 2015 | $7,990 | $92,744 | $28,020 | $64,724 |
| 2014 | $7,990 | $92,744 | $28,020 | $64,724 |
| 2013 | $7,990 | $92,744 | $28,020 | $64,724 |
Source: Public Records
Map
Nearby Homes
- 2155 Kemmerer Ln Unit 2
- 1314 Danhof Dr
- 2198 Kemmerer Ln
- 2151 Kemmerer Ln
- 2049 Mark Cir Unit 1
- 2284 Brookstone Dr
- 1221 Winding Way
- 13151 Lake Mary Dr
- 13121 Wood Duck Dr
- 1086 Patricia Dr
- 1078 Trevor Dr
- 12817 S Slate Ln
- Easton Plan at Riverstone - Classic I Series
- Hudson Plan at Riverstone - Classic II Series
- Colton Plan at Riverstone - The Villas
- Ballard Plan at Riverstone - The Villas
- Dunbar Plan at Riverstone - Classic I Series
- Essex Plan at Riverstone - Classic II Series
- Fairchild Plan at Riverstone - Classic II Series
- Lyndale Plan at Riverstone - Classic II Series
- 2 Fairfax Ct
- 4 Fairfax Ct
- 22538 W 127th St Unit 1
- 1 Fairfax Ct Unit 2
- 5 Fairfax Ct
- 2200 Reagan Blvd
- 9 Fairfax Ct Unit 2
- 6 Fairfax Ct Unit 2
- 8 Fairfax Ct Unit 2
- 7 Fairfax Ct Unit 2
- 2064 Mark Cir Unit 1
- 10 Fairfax Ct Unit 2
- 2060 Mark Cir
- 11 Covington Ct
- 2158 Kemmerer Ln Unit 2
- 2068 Mark Cir Unit 1
- 2162 Kemmerer Ln Unit 2
- 2166 Kemmerer Ln Unit 2
- 2182 Kemmerer Ln Unit 2
- 2178 Kemmerer Ln Unit 2