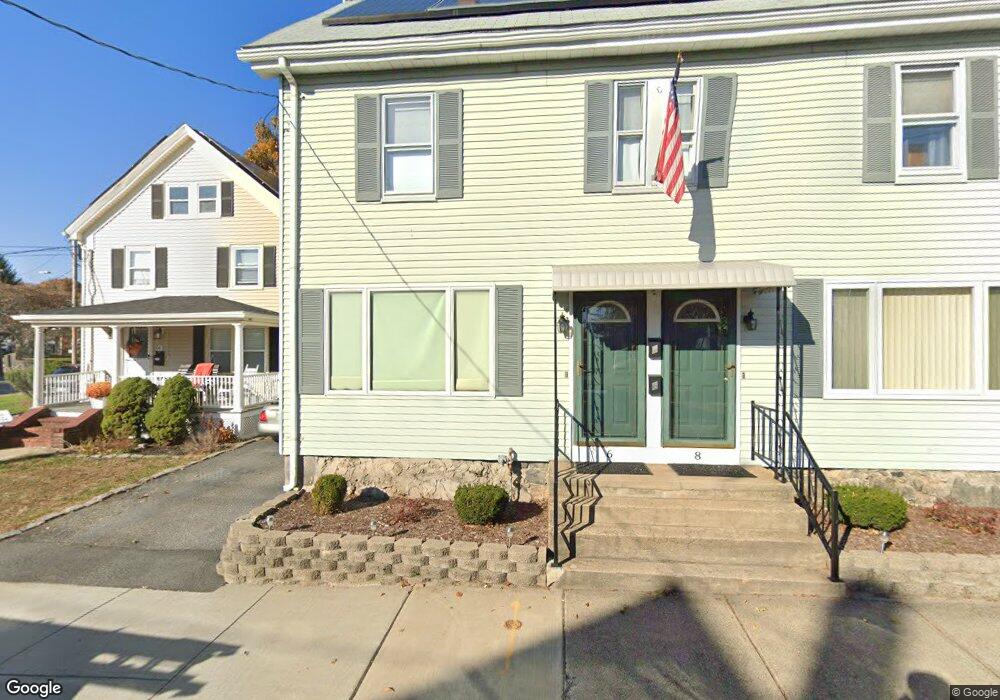
3 Fay Ln Woburn, MA 01801
Downtown Woburn NeighborhoodEstimated Value: $542,977 - $644,000
2
Beds
1
Bath
949
Sq Ft
$609/Sq Ft
Est. Value
About This Home
This home is located at 3 Fay Ln, Woburn, MA 01801 and is currently estimated at $577,994, approximately $609 per square foot. 3 Fay Ln is a home located in Middlesex County with nearby schools including Goodyear Elementary School, Daniel L. Joyce Middle School, and Woburn High School.
Ownership History
Date
Name
Owned For
Owner Type
Purchase Details
Closed on
Apr 6, 2016
Sold by
Kelley Richard A
Bought by
Kelley Richard A and Kelley Daniel A
Current Estimated Value
Purchase Details
Closed on
Mar 18, 1977
Bought by
Kelley Richard A and Kelley Daniel A
Create a Home Valuation Report for This Property
The Home Valuation Report is an in-depth analysis detailing your home's value as well as a comparison with similar homes in the area
Home Values in the Area
Average Home Value in this Area
Purchase History
| Date | Buyer | Sale Price | Title Company |
|---|---|---|---|
| Kelley Richard A | -- | -- | |
| Kelley Richard A | -- | -- | |
| Kelley Richard A | -- | -- | |
| Kelley Richard A | -- | -- |
Source: Public Records
Mortgage History
| Date | Status | Borrower | Loan Amount |
|---|---|---|---|
| Previous Owner | Kelley Richard A | $37,000 | |
| Previous Owner | Kelley Richard A | $40,000 |
Source: Public Records
Tax History Compared to Growth
Tax History
| Year | Tax Paid | Tax Assessment Tax Assessment Total Assessment is a certain percentage of the fair market value that is determined by local assessors to be the total taxable value of land and additions on the property. | Land | Improvement |
|---|---|---|---|---|
| 2025 | $3,792 | $444,000 | $251,600 | $192,400 |
| 2024 | $3,373 | $418,500 | $239,600 | $178,900 |
| 2023 | $3,383 | $388,800 | $217,900 | $170,900 |
| 2022 | $3,231 | $345,900 | $189,400 | $156,500 |
| 2021 | $2,976 | $319,000 | $180,400 | $138,600 |
| 2020 | $2,965 | $318,100 | $180,400 | $137,700 |
| 2019 | $2,871 | $302,200 | $171,800 | $130,400 |
| 2018 | $2,714 | $274,400 | $157,600 | $116,800 |
| 2017 | $2,575 | $259,100 | $150,100 | $109,000 |
| 2016 | $2,452 | $244,000 | $140,300 | $103,700 |
| 2015 | $2,352 | $231,300 | $131,100 | $100,200 |
| 2014 | $2,305 | $220,800 | $131,100 | $89,700 |
Source: Public Records
Map
Nearby Homes
- 14 Cross St
- 44 Main St
- 14 Ash St
- 29 Shepard Ct
- 149 Horn Pond Brook Rd
- 20 Arthur St
- 61 Mount Pleasant St
- 2 George Rd Unit 2
- 237 Swanton St
- 62 Richardson St
- 171 Swanton St Unit 73
- 9 Norfolk Rd
- 64 Garfield Ave
- 200 Swanton St Unit 636
- 200 Swanton St Unit 234
- 200 Swanton St Unit T28
- 15 Sturgis St
- 32 Woodside Rd
- 39 Garfield Ave
- 95 Irving St