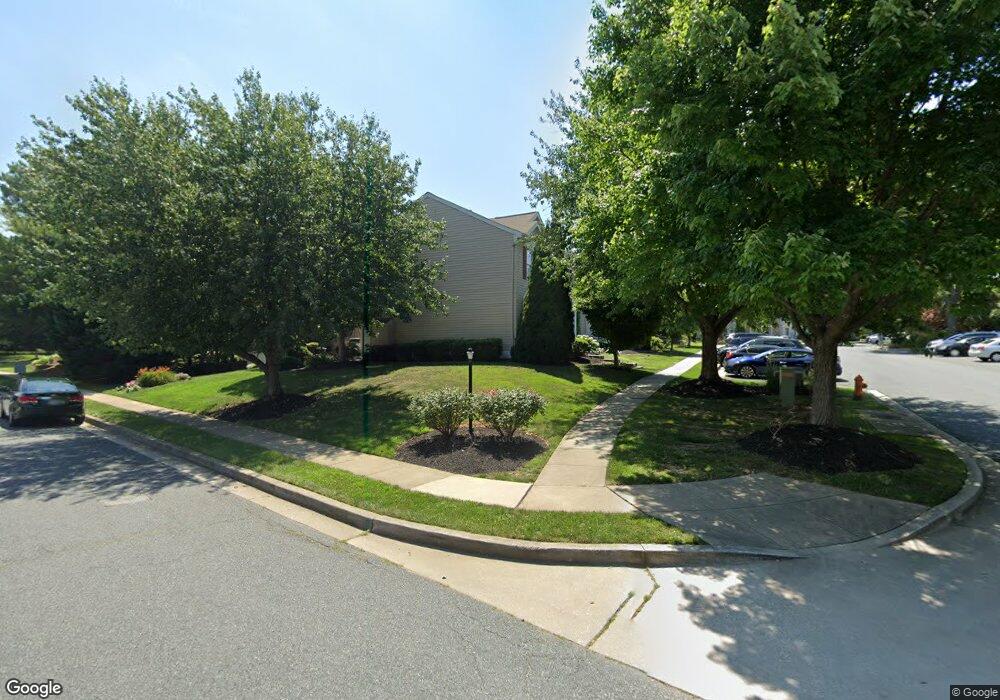
3 Fencerow Ct Nottingham, MD 21236
Estimated Value: $328,267 - $361,000
--
Bed
3
Baths
1,334
Sq Ft
$259/Sq Ft
Est. Value
About This Home
This home is located at 3 Fencerow Ct, Nottingham, MD 21236 and is currently estimated at $345,317, approximately $258 per square foot. 3 Fencerow Ct is a home located in Baltimore County with nearby schools including Perry Hall Elementary School, Perry Hall Middle School, and Perry Hall High School.
Ownership History
Date
Name
Owned For
Owner Type
Purchase Details
Closed on
Nov 21, 2012
Sold by
Anamasi Peter J and Chinnici Anamasi Jill E
Bought by
Noppinger Michael J and Kolb Amanda C
Current Estimated Value
Home Financials for this Owner
Home Financials are based on the most recent Mortgage that was taken out on this home.
Original Mortgage
$214,051
Outstanding Balance
$148,403
Interest Rate
3.46%
Mortgage Type
FHA
Estimated Equity
$196,915
Purchase Details
Closed on
May 1, 2003
Sold by
Anamasi Peter
Bought by
Anamasi Peter J and Chinnici Anamasi Jill E
Purchase Details
Closed on
Aug 27, 2001
Sold by
Schreiber William J
Bought by
Anamasi Peter and Chinniei Jill E
Create a Home Valuation Report for This Property
The Home Valuation Report is an in-depth analysis detailing your home's value as well as a comparison with similar homes in the area
Home Values in the Area
Average Home Value in this Area
Purchase History
| Date | Buyer | Sale Price | Title Company |
|---|---|---|---|
| Noppinger Michael J | $218,000 | Lawyers Express Title Llc | |
| Anamasi Peter J | -- | -- | |
| Anamasi Peter | $136,000 | -- |
Source: Public Records
Mortgage History
| Date | Status | Borrower | Loan Amount |
|---|---|---|---|
| Open | Noppinger Michael J | $214,051 |
Source: Public Records
Tax History Compared to Growth
Tax History
| Year | Tax Paid | Tax Assessment Tax Assessment Total Assessment is a certain percentage of the fair market value that is determined by local assessors to be the total taxable value of land and additions on the property. | Land | Improvement |
|---|---|---|---|---|
| 2025 | $3,665 | $248,700 | -- | -- |
| 2024 | $3,665 | $233,500 | $0 | $0 |
| 2023 | $1,771 | $218,300 | $79,000 | $139,300 |
| 2022 | $3,378 | $215,600 | $0 | $0 |
| 2021 | $3,340 | $212,900 | $0 | $0 |
| 2020 | $3,340 | $210,200 | $79,000 | $131,200 |
| 2019 | $3,118 | $208,367 | $0 | $0 |
| 2018 | $3,151 | $206,533 | $0 | $0 |
| 2017 | $3,056 | $204,700 | $0 | $0 |
| 2016 | $2,608 | $204,700 | $0 | $0 |
| 2015 | $2,608 | $204,700 | $0 | $0 |
| 2014 | $2,608 | $207,000 | $0 | $0 |
Source: Public Records
Map
Nearby Homes
- 34 Open Gate Ct
- 15 Cedarcone Ct
- 4208 Soth Ave
- 51 Cedar Chip Ct
- 9106 Yvonne Ave
- 121 E Orange Ct
- 4232 E Joppa Rd
- 9406 Belair Rd
- 4208 Darnall Rd
- 4233 Soth Ave
- 12 Borgia Ct
- 7 Medici Ct
- 9026 Carlisle Ave
- 36 Romanoff Ct
- 4201 Halbert Ave
- 9 Hapsburg Ct
- 8929 Yvonne Ave
- 112 Hapsburg Ct
- 4411 Ebenezer Rd
- 3800 Meghan Dr Unit 1A