3 Fir Ct Oakland, NJ 07436
Estimated Value: $6,743,373
--
Bed
--
Bath
1,500
Sq Ft
$4,496/Sq Ft
Est. Value
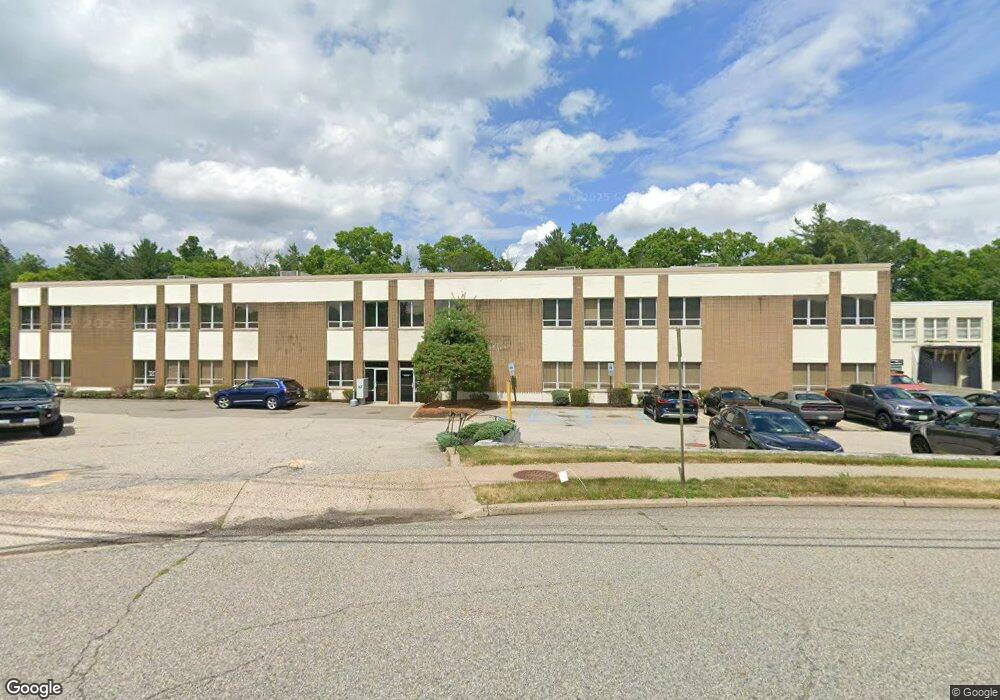
About This Home
This home is located at 3 Fir Ct, Oakland, NJ 07436 and is currently estimated at $6,743,373, approximately $4,495 per square foot. 3 Fir Ct is a home located in Bergen County with nearby schools including Dogwood Hill Elementary School, Valley Middle School, and Indian Hills High School.
Ownership History
Date
Name
Owned For
Owner Type
Purchase Details
Closed on
Dec 28, 2020
Sold by
Okld Llc
Bought by
Fir Court Estates Llc
Current Estimated Value
Home Financials for this Owner
Home Financials are based on the most recent Mortgage that was taken out on this home.
Original Mortgage
$3,290,000
Interest Rate
2.7%
Mortgage Type
Commercial
Purchase Details
Closed on
Mar 28, 2006
Sold by
Fir Court Llc
Bought by
Oklde Llc
Purchase Details
Closed on
Jan 1, 1900
Sold by
Okld Llc
Bought by
Lakeland Bank
Create a Home Valuation Report for This Property
The Home Valuation Report is an in-depth analysis detailing your home's value as well as a comparison with similar homes in the area
Home Values in the Area
Average Home Value in this Area
Purchase History
| Date | Buyer | Sale Price | Title Company |
|---|---|---|---|
| Fir Court Estates Llc | $4,700,000 | Old Republic Natl Ttl Ins Co | |
| Fir Court Estates Llc | $4,700,000 | Old Republic National Title | |
| Oklde Llc | $2,139,000 | -- | |
| Lakeland Bank | -- | None Listed On Document |
Source: Public Records
Mortgage History
| Date | Status | Borrower | Loan Amount |
|---|---|---|---|
| Previous Owner | Fir Court Estates Llc | $3,290,000 |
Source: Public Records
Tax History Compared to Growth
Tax History
| Year | Tax Paid | Tax Assessment Tax Assessment Total Assessment is a certain percentage of the fair market value that is determined by local assessors to be the total taxable value of land and additions on the property. | Land | Improvement |
|---|---|---|---|---|
| 2025 | $123,282 | $5,675,400 | $892,000 | $4,783,400 |
| 2024 | $116,986 | $5,360,100 | $892,000 | $4,468,100 |
| 2023 | $111,144 | $4,927,800 | $780,500 | $4,147,300 |
| 2022 | $111,144 | $4,725,500 | $557,500 | $4,168,000 |
| 2021 | $89,810 | $2,925,400 | $390,300 | $2,535,100 |
| 2020 | $87,733 | $2,925,400 | $390,300 | $2,535,100 |
| 2019 | $84,661 | $2,925,400 | $390,300 | $2,535,100 |
| 2018 | $82,877 | $2,925,400 | $390,300 | $2,535,100 |
| 2017 | $81,794 | $2,925,400 | $390,300 | $2,535,100 |
| 2016 | $79,571 | $2,925,400 | $390,300 | $2,535,100 |
| 2015 | $77,991 | $2,925,400 | $390,300 | $2,535,100 |
| 2014 | $76,382 | $2,925,400 | $390,300 | $2,535,100 |
Source: Public Records
Map
Nearby Homes