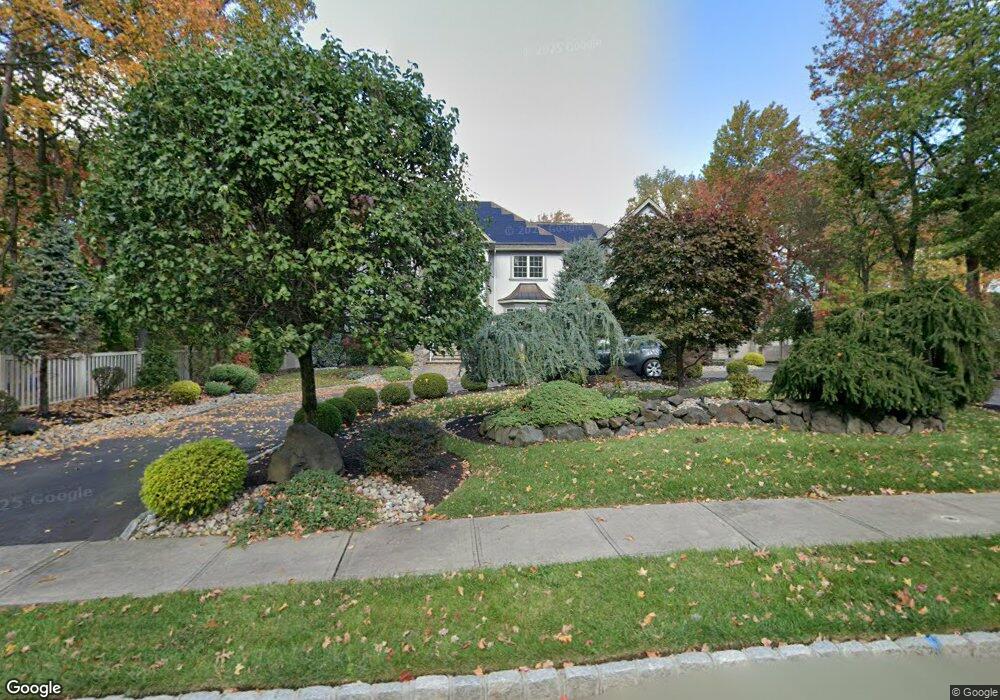
3 Fishel Rd Edison, NJ 08820
Estimated Value: $1,185,792 - $1,324,000
5
Beds
5
Baths
4,400
Sq Ft
$290/Sq Ft
Est. Value
About This Home
This home is located at 3 Fishel Rd, Edison, NJ 08820 and is currently estimated at $1,274,597, approximately $289 per square foot. 3 Fishel Rd is a home located in Middlesex County with nearby schools including Menlo Park Elementary School, Woodrow Wilson Middle School, and J.P. Stevens High School.
Ownership History
Date
Name
Owned For
Owner Type
Purchase Details
Closed on
Jun 7, 2010
Sold by
Gump Industries Ii Llc
Bought by
County Of Middlesex
Current Estimated Value
Purchase Details
Closed on
Oct 10, 2007
Sold by
Gonsalves Global Holdings Llc
Bought by
Sadej Mieczyslaw and Sadej Bozena
Home Financials for this Owner
Home Financials are based on the most recent Mortgage that was taken out on this home.
Original Mortgage
$320,000
Interest Rate
6.43%
Mortgage Type
Purchase Money Mortgage
Create a Home Valuation Report for This Property
The Home Valuation Report is an in-depth analysis detailing your home's value as well as a comparison with similar homes in the area
Home Values in the Area
Average Home Value in this Area
Purchase History
| Date | Buyer | Sale Price | Title Company |
|---|---|---|---|
| County Of Middlesex | -- | None Available | |
| Sadej Mieczyslaw | $400,000 | Consolidated Title Group Llc |
Source: Public Records
Mortgage History
| Date | Status | Borrower | Loan Amount |
|---|---|---|---|
| Previous Owner | Sadej Mieczyslaw | $320,000 |
Source: Public Records
Tax History Compared to Growth
Tax History
| Year | Tax Paid | Tax Assessment Tax Assessment Total Assessment is a certain percentage of the fair market value that is determined by local assessors to be the total taxable value of land and additions on the property. | Land | Improvement |
|---|---|---|---|---|
| 2025 | $27,598 | $463,600 | $111,200 | $352,400 |
| 2024 | $27,450 | $463,600 | $111,200 | $352,400 |
| 2023 | $27,450 | $463,600 | $111,200 | $352,400 |
| 2022 | $27,459 | $463,600 | $111,200 | $352,400 |
| 2021 | $27,116 | $463,600 | $111,200 | $352,400 |
| 2020 | $27,116 | $463,600 | $111,200 | $352,400 |
| 2019 | $26,091 | $463,600 | $111,200 | $352,400 |
| 2018 | $25,461 | $463,600 | $111,200 | $352,400 |
| 2017 | $24,923 | $463,600 | $111,200 | $352,400 |
| 2016 | $23,309 | $441,800 | $111,200 | $330,600 |
| 2015 | $22,417 | $441,800 | $111,200 | $330,600 |
| 2014 | $21,763 | $441,800 | $111,200 | $330,600 |
Source: Public Records
Map
Nearby Homes