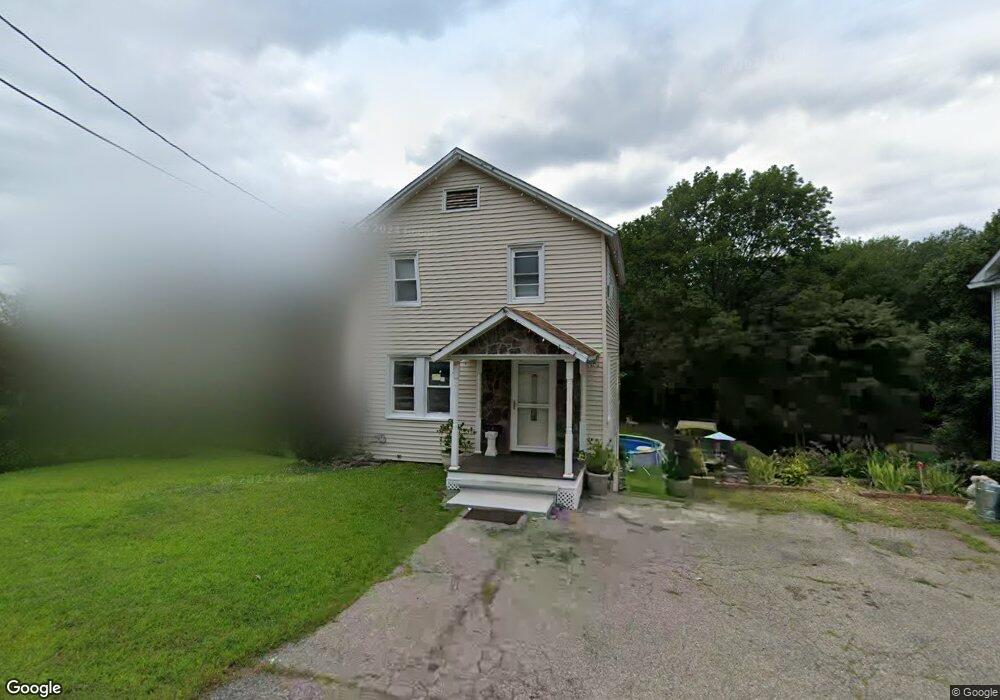
3 Flanders Rd Netcong, NJ 07857
Estimated Value: $311,623 - $438,000
Studio
--
Bath
966
Sq Ft
$379/Sq Ft
Est. Value
About This Home
This home is located at 3 Flanders Rd, Netcong, NJ 07857 and is currently estimated at $366,156, approximately $379 per square foot. 3 Flanders Rd is a home located in Morris County with nearby schools including Netcong Elementary School, Lenape Val Regional High School, and St. Therese School.
Ownership History
Date
Name
Owned For
Owner Type
Purchase Details
Closed on
Jun 27, 2002
Sold by
Latella James
Bought by
Solano Raul
Current Estimated Value
Home Financials for this Owner
Home Financials are based on the most recent Mortgage that was taken out on this home.
Original Mortgage
$137,750
Outstanding Balance
$58,478
Interest Rate
6.73%
Estimated Equity
$307,678
Purchase Details
Closed on
Jun 22, 2001
Sold by
Wilbur Thomas
Bought by
Latella James and Latella Ellen
Home Financials for this Owner
Home Financials are based on the most recent Mortgage that was taken out on this home.
Original Mortgage
$97,500
Interest Rate
7.14%
Purchase Details
Closed on
Aug 22, 1996
Sold by
Wilbur Elizabeth T
Bought by
Latella Eileen M and Wilbur Thomas A
Create a Home Valuation Report for This Property
The Home Valuation Report is an in-depth analysis detailing your home's value as well as a comparison with similar homes in the area
Home Values in the Area
Average Home Value in this Area
Purchase History
| Date | Buyer | Sale Price | Title Company |
|---|---|---|---|
| Solano Raul | $145,000 | -- | |
| Latella James | $50,000 | -- | |
| Latella Eileen M | -- | -- |
Source: Public Records
Mortgage History
| Date | Status | Borrower | Loan Amount |
|---|---|---|---|
| Open | Solano Raul | $137,750 | |
| Previous Owner | Latella James | $97,500 |
Source: Public Records
Tax History
| Year | Tax Paid | Tax Assessment Tax Assessment Total Assessment is a certain percentage of the fair market value that is determined by local assessors to be the total taxable value of land and additions on the property. | Land | Improvement |
|---|---|---|---|---|
| 2025 | $6,468 | $189,300 | $94,200 | $95,100 |
| 2024 | $6,525 | $189,300 | $94,200 | $95,100 |
Source: Public Records
Map
Nearby Homes
- 5 Flanders Rd
- 126 Main St
- 128 Main St
- 7 Flanders Rd
- 7 Flanders Rd
- 130 Main St
- 121 Main St
- 134 Main St Unit 3
- 134 Main St Unit C
- 134 Main St Unit 1
- 134 Main St Unit 1B
- 134 Main St Unit B
- 134 Main St Unit C/B
- 134 Main St Unit 9999
- 134 Main St
- 134 Main St Unit 134
- 134 Main St Unit B
- 125 Main St
- 3 Old Budd Lake Rd
- 5 Old Budd Lake Rd
Your Personal Tour Guide
Ask me questions while you tour the home.