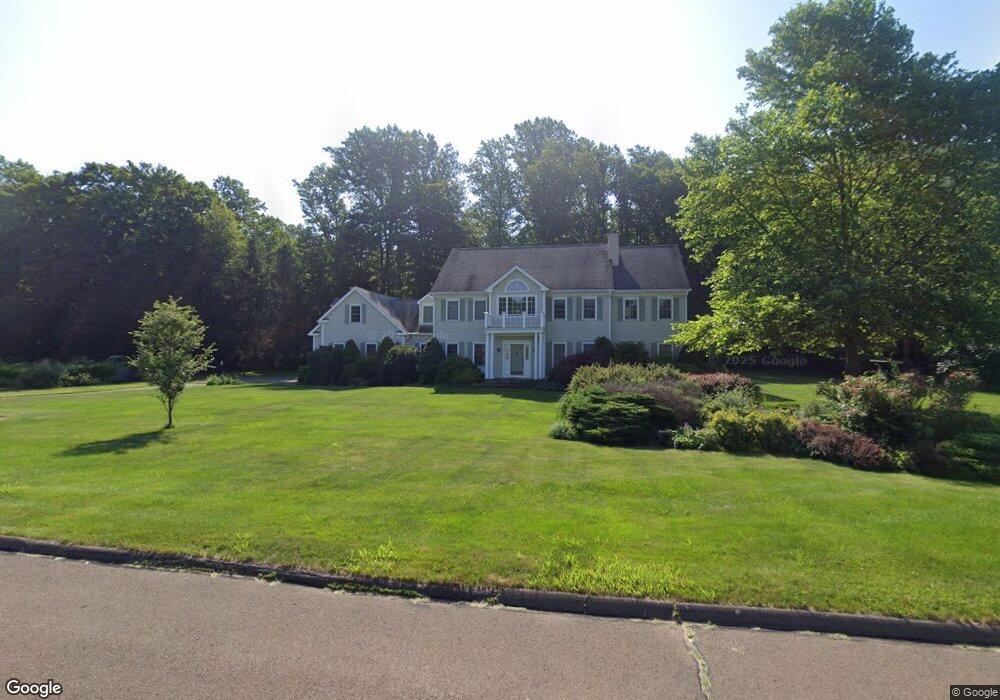
3 Fox Den Way Woodbridge, CT 06525
Estimated Value: $1,102,000 - $1,116,398
5
Beds
5
Baths
5,188
Sq Ft
$214/Sq Ft
Est. Value
About This Home
This home is located at 3 Fox Den Way, Woodbridge, CT 06525 and is currently estimated at $1,111,466, approximately $214 per square foot. 3 Fox Den Way is a home located in New Haven County with nearby schools including Beecher Road Elementary School, Amity Middle School: Orange, and Amity Regional High School.
Ownership History
Date
Name
Owned For
Owner Type
Purchase Details
Closed on
Aug 22, 2018
Sold by
Grau Lauretta E and Pierce Phillip F
Bought by
Pierce Grau Ret and Pierce
Current Estimated Value
Purchase Details
Closed on
Aug 30, 1996
Sold by
Frechette James S
Bought by
Pierce Phillip F and Grau Lauretta E
Create a Home Valuation Report for This Property
The Home Valuation Report is an in-depth analysis detailing your home's value as well as a comparison with similar homes in the area
Home Values in the Area
Average Home Value in this Area
Purchase History
| Date | Buyer | Sale Price | Title Company |
|---|---|---|---|
| Pierce Grau Ret | -- | -- | |
| Pierce Phillip F | $449,000 | -- |
Source: Public Records
Mortgage History
| Date | Status | Borrower | Loan Amount |
|---|---|---|---|
| Previous Owner | Pierce Phillip F | $357,638 | |
| Previous Owner | Pierce Phillip F | $417,000 | |
| Previous Owner | Pierce Phillip F | $490,000 | |
| Previous Owner | Pierce Phillip F | $489,000 |
Source: Public Records
Tax History Compared to Growth
Tax History
| Year | Tax Paid | Tax Assessment Tax Assessment Total Assessment is a certain percentage of the fair market value that is determined by local assessors to be the total taxable value of land and additions on the property. | Land | Improvement |
|---|---|---|---|---|
| 2025 | $21,551 | $660,660 | $131,600 | $529,060 |
| 2024 | $21,083 | $454,090 | $132,720 | $321,370 |
| 2023 | $20,470 | $454,090 | $132,720 | $321,370 |
| 2022 | $19,876 | $454,090 | $132,720 | $321,370 |
| 2021 | $19,362 | $454,090 | $132,720 | $321,370 |
| 2020 | $18,507 | $445,620 | $132,720 | $312,900 |
| 2019 | $19,569 | $486,430 | $140,420 | $346,010 |
| 2018 | $19,375 | $486,430 | $140,420 | $346,010 |
| 2017 | $19,185 | $486,430 | $140,420 | $346,010 |
| 2016 | $18,747 | $486,430 | $140,420 | $346,010 |
| 2015 | $18,319 | $486,430 | $140,420 | $346,010 |
| 2014 | $21,453 | $613,480 | $167,860 | $445,620 |
Source: Public Records
Map
Nearby Homes
- 1166 Old Racebrook Rd
- 4 Brook Rd
- 24 Pleasant Hill Rd
- 54 Northrop Rd
- 71 Beecher Rd
- 4 Stonewall Ln
- 6 Brookside Dr
- 46 Tumblebrook Rd
- 10 Hoinski Way
- 2 Clifford Dr
- 54 Country Club Dr
- 305 Rimmon Rd
- 5 Clifford Dr
- 51 Brookwood Dr
- 25 Glen Dr
- 5 Mohawk Ln
- 120 Pulaski Hwy
- 827 Fountain St
- 2 Barberry Ln
- 151 Benz St