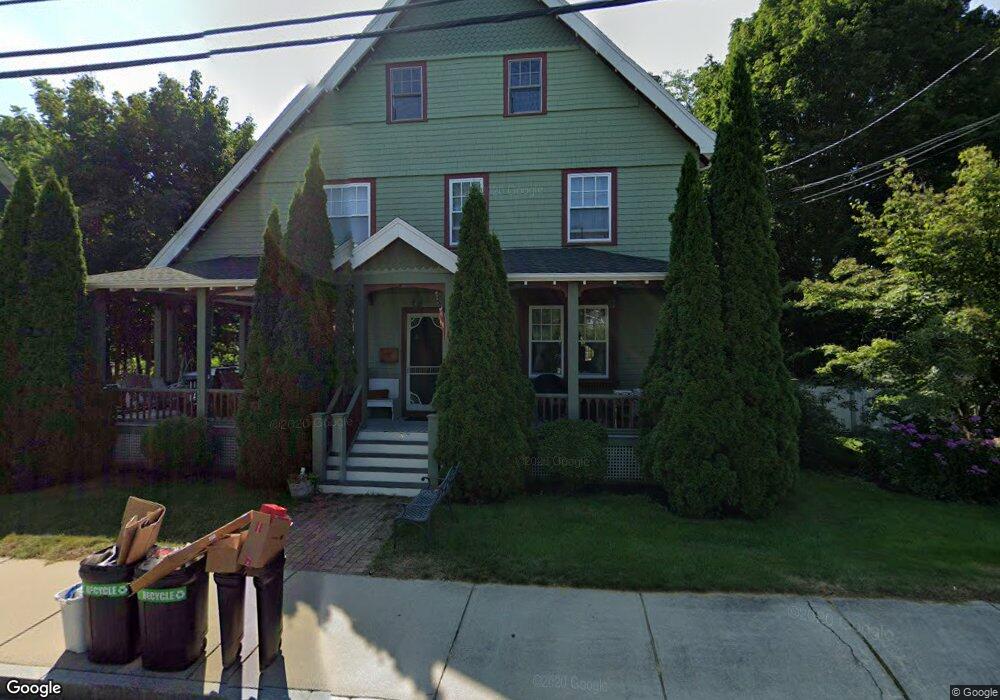
3 Frances St Woburn, MA 01801
Downtown Woburn NeighborhoodEstimated Value: $1,113,711 - $1,315,000
8
Beds
2
Baths
3,467
Sq Ft
$343/Sq Ft
Est. Value
About This Home
This home is located at 3 Frances St, Woburn, MA 01801 and is currently estimated at $1,187,678, approximately $342 per square foot. 3 Frances St is a home located in Middlesex County with nearby schools including Wyman Elementary School, John F. Kennedy Middle School, and Woburn High School.
Ownership History
Date
Name
Owned For
Owner Type
Purchase Details
Closed on
Apr 15, 1998
Sold by
Carlson Doris A
Bought by
Pinkham Margaret M and Anderson Michael D
Current Estimated Value
Purchase Details
Closed on
Mar 10, 1997
Sold by
Power Barry J and Power Amy C
Bought by
Carlson Doris A
Purchase Details
Closed on
Jun 25, 1993
Sold by
Roan Louise A
Bought by
Power Barry J and Power Amy C
Create a Home Valuation Report for This Property
The Home Valuation Report is an in-depth analysis detailing your home's value as well as a comparison with similar homes in the area
Home Values in the Area
Average Home Value in this Area
Purchase History
| Date | Buyer | Sale Price | Title Company |
|---|---|---|---|
| Pinkham Margaret M | $322,750 | -- | |
| Carlson Doris A | $262,000 | -- | |
| Power Barry J | $177,000 | -- |
Source: Public Records
Mortgage History
| Date | Status | Borrower | Loan Amount |
|---|---|---|---|
| Closed | Power Barry J | $351,000 | |
| Closed | Power Barry J | $183,000 |
Source: Public Records
Tax History Compared to Growth
Tax History
| Year | Tax Paid | Tax Assessment Tax Assessment Total Assessment is a certain percentage of the fair market value that is determined by local assessors to be the total taxable value of land and additions on the property. | Land | Improvement |
|---|---|---|---|---|
| 2025 | $8,279 | $969,400 | $339,000 | $630,400 |
| 2024 | $7,451 | $924,500 | $323,000 | $601,500 |
| 2023 | $7,336 | $843,200 | $293,700 | $549,500 |
| 2022 | $6,901 | $738,900 | $255,900 | $483,000 |
| 2021 | $6,594 | $706,700 | $243,900 | $462,800 |
| 2020 | $6,102 | $654,700 | $243,900 | $410,800 |
| 2019 | $6,007 | $632,300 | $232,500 | $399,800 |
| 2018 | $5,933 | $599,900 | $213,600 | $386,300 |
| 2017 | $5,836 | $587,100 | $203,700 | $383,400 |
| 2016 | $5,588 | $556,000 | $190,600 | $365,400 |
| 2015 | $5,500 | $540,800 | $178,400 | $362,400 |
| 2014 | $5,365 | $513,900 | $178,400 | $335,500 |
Source: Public Records
Map
Nearby Homes