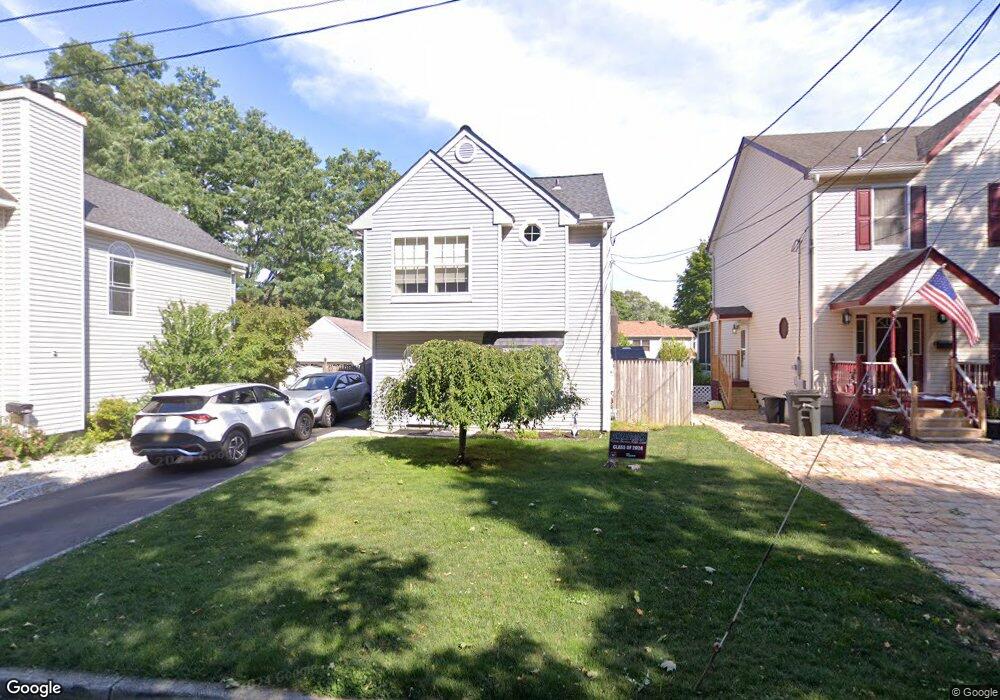
3 Franklin St Matawan, NJ 07747
Estimated Value: $440,000 - $510,000
3
Beds
2
Baths
1,028
Sq Ft
$462/Sq Ft
Est. Value
About This Home
This home is located at 3 Franklin St, Matawan, NJ 07747 and is currently estimated at $475,075, approximately $462 per square foot. 3 Franklin St is a home located in Monmouth County with nearby schools including Matawan Reg High School, Matawan Montessori Academy, and St. Joseph Elementary School.
Ownership History
Date
Name
Owned For
Owner Type
Purchase Details
Closed on
May 8, 2003
Sold by
Lynton Christina
Bought by
Spisak Christine
Current Estimated Value
Home Financials for this Owner
Home Financials are based on the most recent Mortgage that was taken out on this home.
Original Mortgage
$213,150
Interest Rate
5.71%
Mortgage Type
FHA
Purchase Details
Closed on
Apr 10, 1996
Sold by
Johnson Thomas
Bought by
Lynton Christina
Home Financials for this Owner
Home Financials are based on the most recent Mortgage that was taken out on this home.
Original Mortgage
$108,000
Interest Rate
7.82%
Create a Home Valuation Report for This Property
The Home Valuation Report is an in-depth analysis detailing your home's value as well as a comparison with similar homes in the area
Home Values in the Area
Average Home Value in this Area
Purchase History
| Date | Buyer | Sale Price | Title Company |
|---|---|---|---|
| Spisak Christine | $215,000 | -- | |
| Lynton Christina | $120,000 | -- |
Source: Public Records
Mortgage History
| Date | Status | Borrower | Loan Amount |
|---|---|---|---|
| Previous Owner | Spisak Christine | $213,150 | |
| Previous Owner | Lynton Christina | $108,000 |
Source: Public Records
Tax History
| Year | Tax Paid | Tax Assessment Tax Assessment Total Assessment is a certain percentage of the fair market value that is determined by local assessors to be the total taxable value of land and additions on the property. | Land | Improvement |
|---|---|---|---|---|
| 2025 | $9,186 | $438,100 | $280,200 | $157,900 |
| 2024 | $8,903 | $420,800 | $295,200 | $125,600 |
Source: Public Records
Map
Nearby Homes
- 258 Jackson St
- 272 Main St
- 190 Jackson St
- 9 Fountain Ave
- 320 Main St
- 101 Broad St
- 255 Harding Blvd
- 48 Charles St
- 14 New Brunswick Ave
- 8 Sutphin Ave
- 259 Matawan Ave
- 45 Beechwood Terrace
- 5 7th St
- 101 Ravine Dr
- 68 Main St
- 537 S Atlantic Ave
- 326 Sloan Ct Unit 326
- 10 Johnson Ave
- 27 Middlesex Rd
- 414 Sloan Ct
Your Personal Tour Guide
Ask me questions while you tour the home.