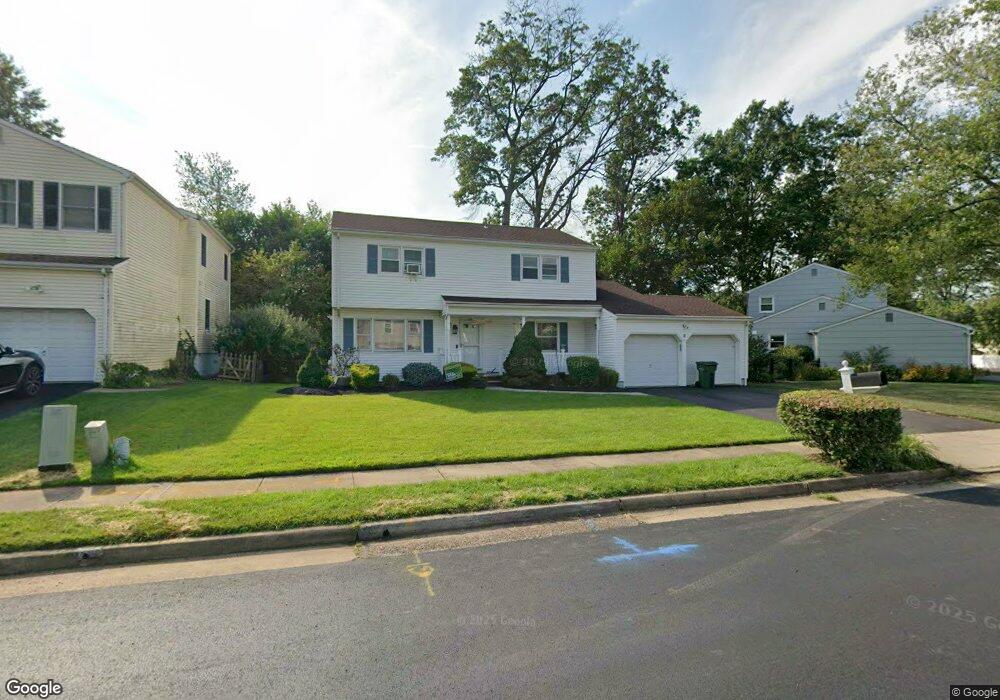
3 Ginesi Ct Edison, NJ 08817
Estimated Value: $747,058 - $902,000
4
Beds
2
Baths
1,937
Sq Ft
$430/Sq Ft
Est. Value
About This Home
This home is located at 3 Ginesi Ct, Edison, NJ 08817 and is currently estimated at $833,015, approximately $430 per square foot. 3 Ginesi Ct is a home located in Middlesex County with nearby schools including Woodbrook Elementary School, Woodrow Wilson Middle School, and J.P. Stevens High School.
Ownership History
Date
Name
Owned For
Owner Type
Purchase Details
Closed on
Jun 2, 2017
Sold by
Bonds Keith D
Bought by
Oak Anirudha and Oak Aparna
Current Estimated Value
Home Financials for this Owner
Home Financials are based on the most recent Mortgage that was taken out on this home.
Original Mortgage
$468,350
Outstanding Balance
$389,570
Interest Rate
4.02%
Mortgage Type
New Conventional
Estimated Equity
$443,445
Create a Home Valuation Report for This Property
The Home Valuation Report is an in-depth analysis detailing your home's value as well as a comparison with similar homes in the area
Home Values in the Area
Average Home Value in this Area
Purchase History
| Date | Buyer | Sale Price | Title Company |
|---|---|---|---|
| Oak Anirudha | $504,000 | Associated Title Agency Llc |
Source: Public Records
Mortgage History
| Date | Status | Borrower | Loan Amount |
|---|---|---|---|
| Open | Oak Anirudha | $468,350 |
Source: Public Records
Tax History Compared to Growth
Tax History
| Year | Tax Paid | Tax Assessment Tax Assessment Total Assessment is a certain percentage of the fair market value that is determined by local assessors to be the total taxable value of land and additions on the property. | Land | Improvement |
|---|---|---|---|---|
| 2025 | $12,049 | $202,400 | $80,800 | $121,600 |
| 2024 | $11,984 | $202,400 | $80,800 | $121,600 |
| 2023 | $11,984 | $202,400 | $80,800 | $121,600 |
| 2022 | $11,988 | $202,400 | $80,800 | $121,600 |
| 2021 | $11,948 | $202,400 | $80,800 | $121,600 |
| 2020 | $11,248 | $192,300 | $80,800 | $111,500 |
| 2019 | $10,579 | $192,300 | $80,800 | $111,500 |
| 2018 | $10,194 | $192,300 | $80,800 | $111,500 |
| 2017 | $10,194 | $189,700 | $80,800 | $108,900 |
| 2016 | $10,009 | $189,700 | $80,800 | $108,900 |
| 2015 | $9,625 | $189,700 | $80,800 | $108,900 |
| 2014 | $9,345 | $189,700 | $80,800 | $108,900 |
Source: Public Records
Map
Nearby Homes