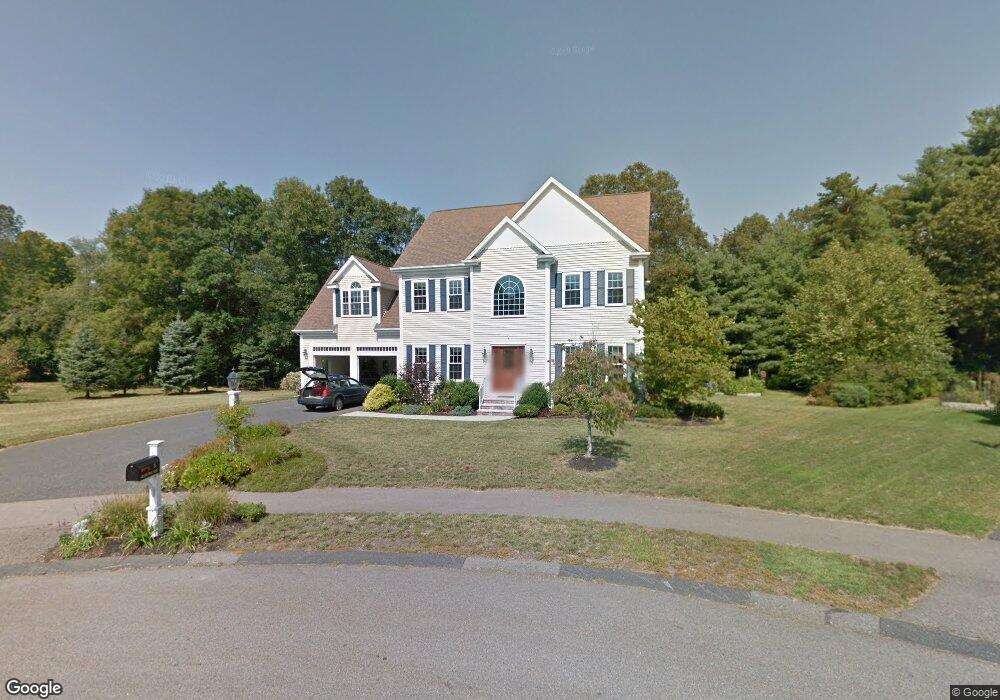
3 Grapevine Way Medway, MA 02053
Estimated Value: $981,923 - $1,130,000
4
Beds
3
Baths
3,200
Sq Ft
$328/Sq Ft
Est. Value
About This Home
This home is located at 3 Grapevine Way, Medway, MA 02053 and is currently estimated at $1,049,731, approximately $328 per square foot. 3 Grapevine Way is a home located in Norfolk County with nearby schools including John D. McGovern Elementary School, Burke-Memorial Elementary, and Medway Middle School.
Ownership History
Date
Name
Owned For
Owner Type
Purchase Details
Closed on
Nov 14, 2012
Sold by
Collord Randall C and Collord Carol A
Bought by
A R C and A Collord T
Current Estimated Value
Purchase Details
Closed on
May 15, 2006
Sold by
Rojee&Leland Homes Inc
Bought by
Collord Randall C and Collord Carol A
Home Financials for this Owner
Home Financials are based on the most recent Mortgage that was taken out on this home.
Original Mortgage
$200,000
Interest Rate
6.4%
Mortgage Type
Purchase Money Mortgage
Create a Home Valuation Report for This Property
The Home Valuation Report is an in-depth analysis detailing your home's value as well as a comparison with similar homes in the area
Home Values in the Area
Average Home Value in this Area
Purchase History
| Date | Buyer | Sale Price | Title Company |
|---|---|---|---|
| A R C | -- | -- | |
| Collord Randall C | $649,900 | -- |
Source: Public Records
Mortgage History
| Date | Status | Borrower | Loan Amount |
|---|---|---|---|
| Previous Owner | Collord Randall C | $200,000 |
Source: Public Records
Tax History Compared to Growth
Tax History
| Year | Tax Paid | Tax Assessment Tax Assessment Total Assessment is a certain percentage of the fair market value that is determined by local assessors to be the total taxable value of land and additions on the property. | Land | Improvement |
|---|---|---|---|---|
| 2025 | $12,234 | $858,500 | $323,400 | $535,100 |
| 2024 | $12,362 | $858,500 | $323,400 | $535,100 |
| 2023 | $11,549 | $724,500 | $294,300 | $430,200 |
| 2022 | $10,781 | $636,800 | $217,600 | $419,200 |
| 2021 | $10,862 | $622,100 | $203,100 | $419,000 |
| 2020 | $10,724 | $612,800 | $203,100 | $409,700 |
| 2019 | $10,219 | $602,200 | $194,800 | $407,400 |
| 2018 | $10,518 | $595,600 | $194,800 | $400,800 |
| 2017 | $10,173 | $567,700 | $186,600 | $381,100 |
| 2016 | $10,093 | $557,300 | $176,200 | $381,100 |
| 2015 | $10,047 | $550,800 | $176,200 | $374,600 |
| 2014 | $9,233 | $490,100 | $176,200 | $313,900 |
Source: Public Records
Map
Nearby Homes