Estimated Value: $592,000 - $703,614
2
Beds
1
Bath
900
Sq Ft
$727/Sq Ft
Est. Value
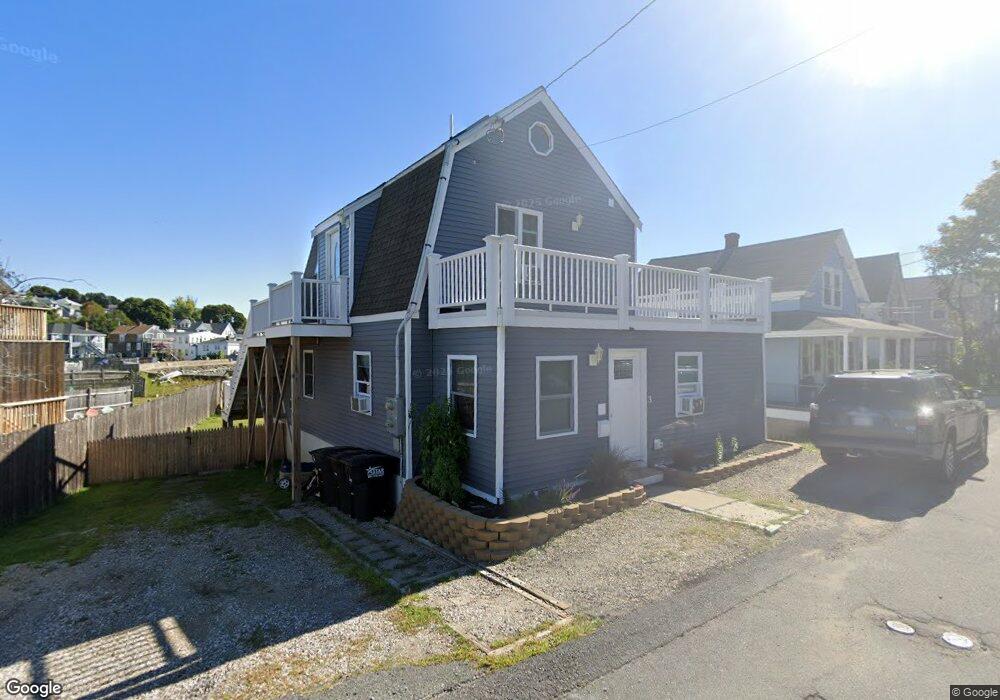
About This Home
This home is located at 3 Hampton Cir Unit 1, Hull, MA 02045 and is currently estimated at $654,404, approximately $727 per square foot. 3 Hampton Cir Unit 1 is a home located in Plymouth County with nearby schools including Lillian M. Jacobs Elementary School, Memorial Middle School, and Hull High School.
Ownership History
Date
Name
Owned For
Owner Type
Purchase Details
Closed on
Oct 26, 2018
Sold by
Hamilton Stacy
Bought by
Ohman Derick
Current Estimated Value
Home Financials for this Owner
Home Financials are based on the most recent Mortgage that was taken out on this home.
Original Mortgage
$360,254
Outstanding Balance
$310,955
Interest Rate
4.6%
Mortgage Type
FHA
Estimated Equity
$343,449
Purchase Details
Closed on
Feb 2, 2005
Sold by
Marrocco Aleta and Leone Paul J
Bought by
Leone Paul and Leone Aleta E
Home Financials for this Owner
Home Financials are based on the most recent Mortgage that was taken out on this home.
Original Mortgage
$197,000
Interest Rate
5.77%
Mortgage Type
Purchase Money Mortgage
Purchase Details
Closed on
Jun 26, 2002
Sold by
Garber Roy
Bought by
Leone Paul and Marrocco Aleta E
Home Financials for this Owner
Home Financials are based on the most recent Mortgage that was taken out on this home.
Original Mortgage
$184,000
Interest Rate
6.92%
Mortgage Type
Purchase Money Mortgage
Create a Home Valuation Report for This Property
The Home Valuation Report is an in-depth analysis detailing your home's value as well as a comparison with similar homes in the area
Purchase History
| Date | Buyer | Sale Price | Title Company |
|---|---|---|---|
| Ohman Derick | $366,900 | -- | |
| Hamilton Stacy | -- | -- | |
| Leone Paul | -- | -- | |
| Leone Paul | $230,000 | -- |
Source: Public Records
Mortgage History
| Date | Status | Borrower | Loan Amount |
|---|---|---|---|
| Open | Ohman Derick | $360,254 | |
| Previous Owner | Leone Paul | $197,000 | |
| Previous Owner | Leone Paul | $184,000 | |
| Previous Owner | Leone Paul | $60,000 |
Source: Public Records
Tax History
| Year | Tax Paid | Tax Assessment Tax Assessment Total Assessment is a certain percentage of the fair market value that is determined by local assessors to be the total taxable value of land and additions on the property. | Land | Improvement |
|---|---|---|---|---|
| 2025 | $5,263 | $469,900 | $230,400 | $239,500 |
| 2024 | $4,806 | $412,500 | $215,000 | $197,500 |
| 2023 | $4,726 | $388,300 | $215,000 | $173,300 |
| 2022 | $4,583 | $365,500 | $202,800 | $162,700 |
| 2021 | $7,855 | $358,100 | $184,300 | $173,800 |
| 2020 | $15,374 | $333,000 | $178,200 | $154,800 |
| 2019 | $3,884 | $297,600 | $172,000 | $125,600 |
| 2018 | $4,841 | $287,600 | $172,000 | $115,600 |
| 2017 | $3,946 | $287,600 | $172,000 | $115,600 |
| 2016 | $3,877 | $287,600 | $172,000 | $115,600 |
| 2015 | $4,009 | $287,600 | $172,000 | $115,600 |
| 2014 | $3,734 | $269,200 | $153,600 | $115,600 |
Source: Public Records
Map
Nearby Homes
- 137 Hampton Cir
- 18 Standish Rd
- 127 Hampton Cir
- 7 Bay St Unit 10
- 00 George Washington Blvd
- 53 Mountford Rd
- 155 George Washington Blvd Unit 210
- 10 Berkley Rd Unit A
- 2 6th St
- 22 Berkley Rd Unit B
- 23 Wyola Rd
- 121 Nantasket Ave Unit 503
- 120 Nantasket Ave Unit 207
- 120 Nantasket Ave Unit 204
- 120 Nantasket Ave Unit 304
- 120 Nantasket Ave Unit PH5
- 120 Nantasket Ave Unit 201
- 1 Longbeach Ave Unit 202
- 99 Nantasket Ave
- 141 Edgewater Rd
- 3 Hampton Cir
- 5 Hampton Cir
- 1 Hampton Cir
- 17 Moreland Ave
- 7 Hampton Cir
- 4 Hampton Cir
- 8 Hampton Cir
- 15 Moreland Ave
- 2 Hampton Cir
- 13 Moreland Ave Unit 1
- 9 Hampton Cir
- 13 Moreland Ave
- 11 Moreland Ave
- 11 Moreland Ave
- 11 Moreland Ave Unit summer
- 11 Moreland Ave Unit winter rent
- 19 Mayflower Ave
- 11 Moreland Ave August Unit summer
- 11 Moreland Ave-Waterfront
- 11 Moreland Avenue August Unit summer
Your Personal Tour Guide
Ask me questions while you tour the home.