3 Hardy Ct Derry, NH 03038
Derry AreaEstimated Value: $524,000 - $601,000
About This Home
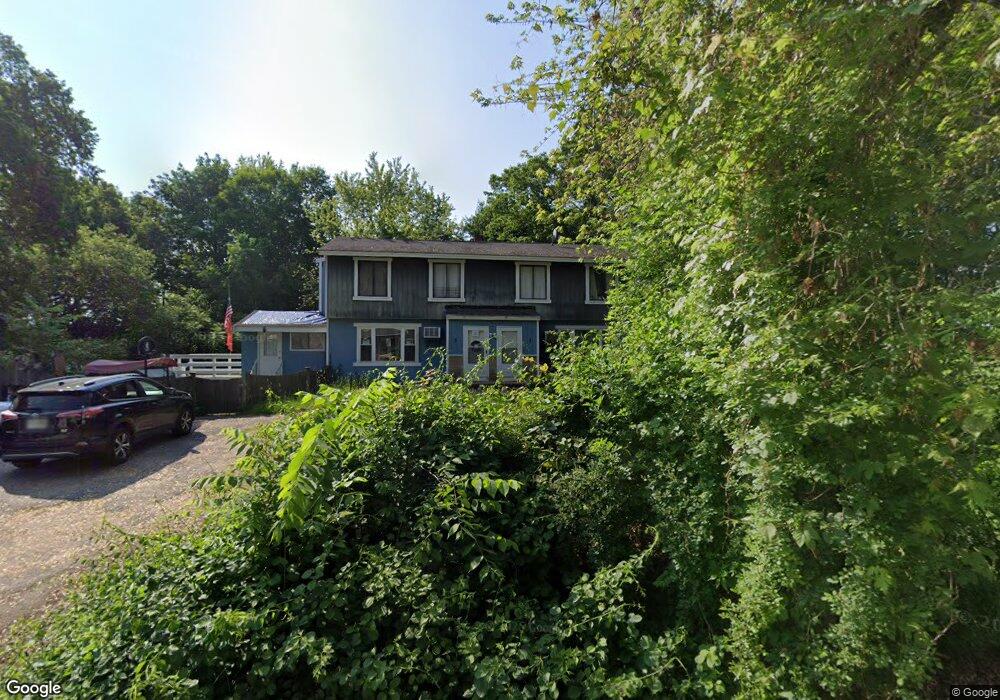
This home is located at 3 Hardy Ct, Derry, NH 03038 and is currently estimated at $564,594, approximately $249 per square foot. 3 Hardy Ct is a home located in Rockingham County with nearby schools including Grinnell School, Gilbert H. Hood Middle School, and Pinkerton Academy.
Ownership History
We collect this data history from publicly available records. To have your information removed, we recommend requesting removal directly through your county’s website.
Purchase Details
Purchase Details
Purchase Details
Home Values in the Area
Average Home Value in this Area
Purchase History
We collect this data history from publicly available records. To have your information removed, we recommend requesting removal directly through your county’s website.
| Date | Buyer | Sale Price | Title Company |
|---|---|---|---|
| $102,000 | -- | ||
| $253,400 | -- | ||
| $255,000 | -- |
Mortgage History
We collect this data history from publicly available records. To have your information removed, we recommend requesting removal directly through your county’s website.
| Date | Status | Borrower | Loan Amount |
|---|---|---|---|
| Open | $70,000 | ||
| Open | $192,783 | ||
| Closed | $193,240 |
Tax History
We collect this data history from publicly available records. To have your information removed, we recommend requesting removal directly through your county’s website.
| Year | Tax Paid | Tax Assessment Tax Assessment Total Assessment is a certain percentage of the fair market value that is determined by local assessors to be the total taxable value of land and additions on the property. | Land | Improvement |
|---|---|---|---|---|
| 2025 | $8,414 | $443,100 | $214,000 | $229,100 |
| 2024 | $8,282 | $443,100 | $214,000 | $229,100 |
| 2023 | $8,243 | $398,600 | $181,900 | $216,700 |
| 2022 | $7,589 | $398,600 | $181,900 | $216,700 |
| 2021 | $7,386 | $298,300 | $137,900 | $160,400 |
| 2020 | $7,261 | $298,300 | $137,900 | $160,400 |
| 2019 | $6,786 | $259,800 | $104,400 | $155,400 |
| 2018 | $6,763 | $259,800 | $104,400 | $155,400 |
| 2017 | $6,271 | $217,300 | $90,100 | $127,200 |
| 2016 | $5,880 | $217,300 | $90,100 | $127,200 |
| 2015 | $5,510 | $188,500 | $75,900 | $112,600 |
| 2014 | $5,546 | $188,500 | $75,900 | $112,600 |
| 2013 | $5,838 | $185,400 | $71,200 | $114,200 |
Map
- 32 Crystal Ave
- 9 Grove St
- 10 Birch St
- 102 E Broadway
- 6 Concord Ave
- 11 Sundown Dr Unit D
- 107 Franklin Street Extension Unit 8
- 31 Hillside Ave
- 3 Fairfax Ave Unit 143
- 3 Fairfax Ave Unit 333
- 24 Fairview Ave
- 16 Brook St
- 18 Brook St
- 12 Chester Rd
- 1 Newell Dr
- 5 Tsienneto Rd Unit 5
- 7 Chester Rd Unit 306
- 13 Nesmith St
- 13 Silvestri Cir Unit 7
- 13 Silvestri Cir Unit 19
Ask me questions while you tour the home.