3 Hemlock Cir Millis, MA 02054
Estimated Value: $425,000 - $448,000
3
Beds
2
Baths
1,300
Sq Ft
$335/Sq Ft
Est. Value
About This Home
This home is located at 3 Hemlock Cir, Millis, MA 02054 and is currently estimated at $435,528, approximately $335 per square foot. 3 Hemlock Cir is a home located in Norfolk County with nearby schools including Clyde F Brown, Millis Middle School, and Millis High School.
Ownership History
Date
Name
Owned For
Owner Type
Purchase Details
Closed on
Mar 5, 2025
Sold by
Schulz Kermit J and Schulz Jennifer A
Bought by
3 Hemlock Cir Rt and Schulz
Current Estimated Value
Purchase Details
Closed on
Sep 18, 2006
Sold by
Phaneuf Brad D and Meszaros Kari A
Bought by
Schulz Jennifer A and Schulz Kermit J
Home Financials for this Owner
Home Financials are based on the most recent Mortgage that was taken out on this home.
Original Mortgage
$230,375
Interest Rate
6.71%
Mortgage Type
Purchase Money Mortgage
Purchase Details
Closed on
May 31, 2006
Sold by
Backstrom Arlene E and Ruisi Arlene E
Bought by
Phaneuf Brad D and Meszaros Kari A
Home Financials for this Owner
Home Financials are based on the most recent Mortgage that was taken out on this home.
Original Mortgage
$220,400
Interest Rate
6.55%
Mortgage Type
Purchase Money Mortgage
Create a Home Valuation Report for This Property
The Home Valuation Report is an in-depth analysis detailing your home's value as well as a comparison with similar homes in the area
Home Values in the Area
Average Home Value in this Area
Purchase History
| Date | Buyer | Sale Price | Title Company |
|---|---|---|---|
| 3 Hemlock Cir Rt | -- | None Available | |
| 3 Hemlock Cir Rt | -- | None Available | |
| Schulz Jennifer A | $242,500 | -- | |
| Schulz Jennifer A | $242,500 | -- | |
| Phaneuf Brad D | $232,000 | -- | |
| Phaneuf Brad D | $232,000 | -- |
Source: Public Records
Mortgage History
| Date | Status | Borrower | Loan Amount |
|---|---|---|---|
| Previous Owner | Schulz Jennifer A | $230,375 | |
| Previous Owner | Phaneuf Brad D | $220,400 | |
| Previous Owner | Phaneuf Brad D | $55,000 |
Source: Public Records
Tax History
| Year | Tax Paid | Tax Assessment Tax Assessment Total Assessment is a certain percentage of the fair market value that is determined by local assessors to be the total taxable value of land and additions on the property. | Land | Improvement |
|---|---|---|---|---|
| 2025 | $5,435 | $331,400 | $0 | $331,400 |
| 2024 | $5,392 | $328,400 | $0 | $328,400 |
| 2023 | $4,117 | $235,400 | $0 | $235,400 |
| 2022 | $4,461 | $236,300 | $0 | $236,300 |
| 2021 | $4,367 | $222,600 | $0 | $222,600 |
| 2020 | $4,773 | $237,000 | $0 | $237,000 |
| 2019 | $3,936 | $210,500 | $0 | $210,500 |
| 2018 | $3,793 | $210,500 | $0 | $210,500 |
| 2017 | $3,325 | $180,500 | $0 | $180,500 |
| 2016 | $3,148 | $180,500 | $0 | $180,500 |
| 2015 | $3,069 | $180,500 | $0 | $180,500 |
Source: Public Records
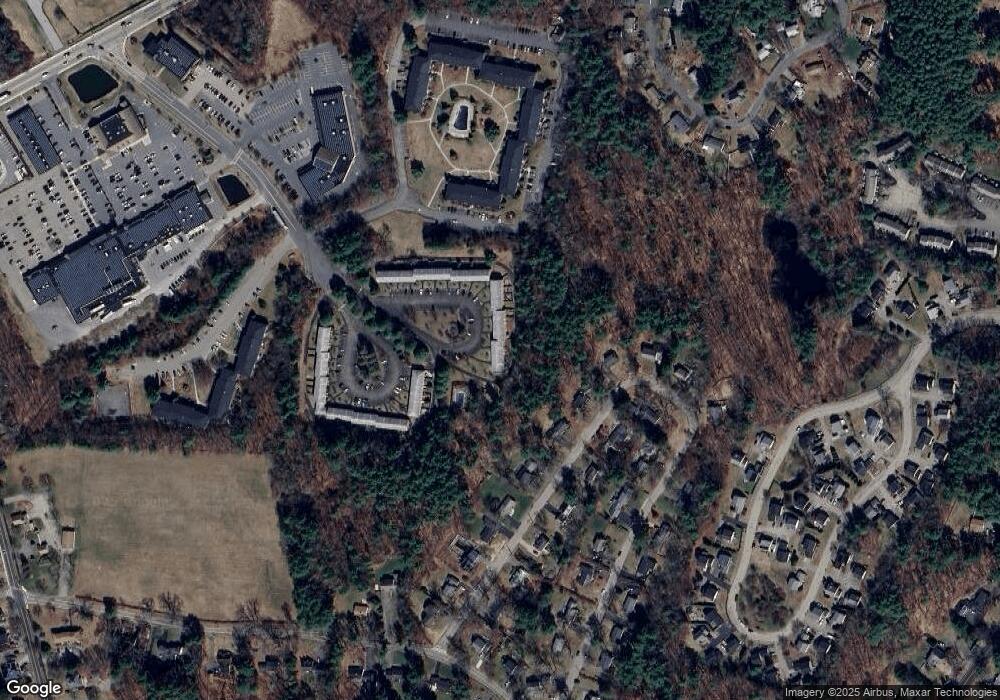
Map
Nearby Homes
Your Personal Tour Guide
Ask me questions while you tour the home.