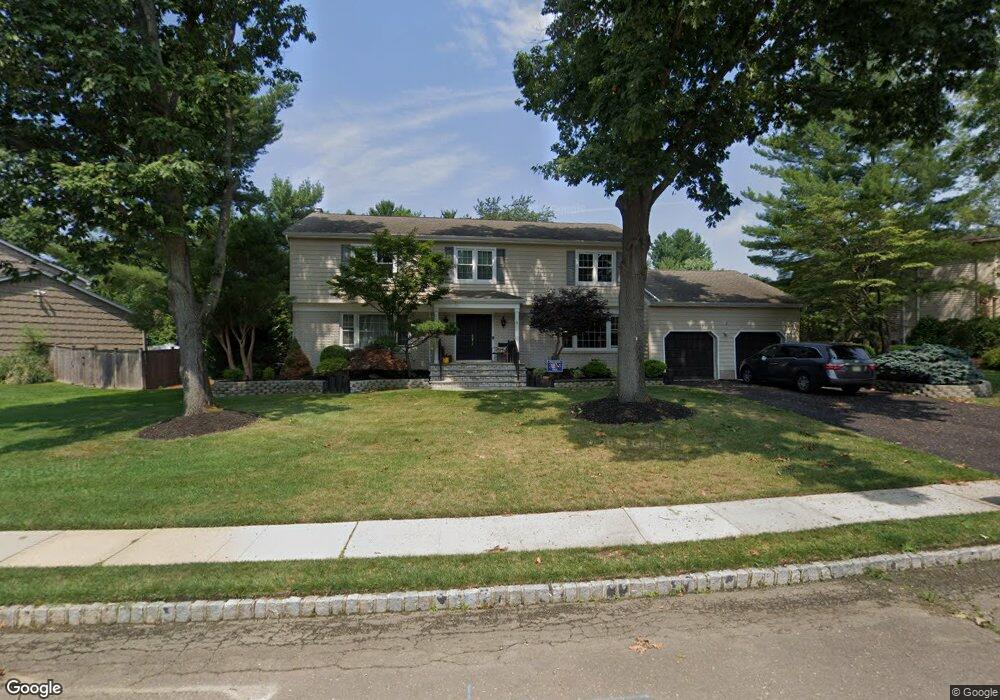
3 Hemlock Ln Marlboro, NJ 07746
Estimated Value: $892,000 - $1,120,000
4
Beds
2
Baths
3,070
Sq Ft
$327/Sq Ft
Est. Value
About This Home
This home is located at 3 Hemlock Ln, Marlboro, NJ 07746 and is currently estimated at $1,002,359, approximately $326 per square foot. 3 Hemlock Ln is a home located in Monmouth County with nearby schools including Asher Holmes Elementary School, Marlboro Middle School, and Marlboro High School.
Ownership History
Date
Name
Owned For
Owner Type
Purchase Details
Closed on
Jul 25, 2016
Sold by
Schutzbank Roberta
Bought by
Ahmed Shameem and Ahmed Nur S
Current Estimated Value
Home Financials for this Owner
Home Financials are based on the most recent Mortgage that was taken out on this home.
Original Mortgage
$436,000
Outstanding Balance
$347,835
Interest Rate
3.56%
Mortgage Type
Purchase Money Mortgage
Estimated Equity
$654,524
Purchase Details
Closed on
Nov 27, 1978
Bought by
Schutzbank Barry and Schutzbank Roberta
Create a Home Valuation Report for This Property
The Home Valuation Report is an in-depth analysis detailing your home's value as well as a comparison with similar homes in the area
Home Values in the Area
Average Home Value in this Area
Purchase History
| Date | Buyer | Sale Price | Title Company |
|---|---|---|---|
| Ahmed Shameem | $545,000 | First American Title | |
| Schutzbank Barry | $92,100 | -- |
Source: Public Records
Mortgage History
| Date | Status | Borrower | Loan Amount |
|---|---|---|---|
| Open | Ahmed Shameem | $436,000 |
Source: Public Records
Tax History
| Year | Tax Paid | Tax Assessment Tax Assessment Total Assessment is a certain percentage of the fair market value that is determined by local assessors to be the total taxable value of land and additions on the property. | Land | Improvement |
|---|---|---|---|---|
| 2025 | $12,862 | $515,700 | $185,200 | $330,500 |
| 2024 | $12,294 | $515,700 | $185,200 | $330,500 |
| 2023 | $12,294 | $515,700 | $185,200 | $330,500 |
| 2022 | $11,980 | $515,700 | $185,200 | $330,500 |
| 2021 | $11,861 | $515,700 | $185,200 | $330,500 |
| 2020 | $11,856 | $515,700 | $185,200 | $330,500 |
| 2019 | $11,861 | $515,700 | $185,200 | $330,500 |
| 2018 | $11,660 | $515,700 | $185,200 | $330,500 |
| 2017 | $11,433 | $515,700 | $185,200 | $330,500 |
| 2016 | $11,387 | $515,700 | $185,200 | $330,500 |
| 2015 | $10,782 | $507,200 | $185,200 | $322,000 |
| 2014 | $9,979 | $465,400 | $155,200 | $310,200 |
Source: Public Records
Map
Nearby Homes
- 2 Capo Dr
- 220 Tracy Dr
- 4 Canadian Woods Rd
- 1 Lake Ontario Ln
- 141 Micki Dr
- 34 Brookside Cir
- 3 Alberta Dr
- 25 Whitney Dr
- 28 Georgian Bay Dr
- 481 Tennent Rd
- 14 Juniper Ave
- 15 Prides Ln
- 5 Washington Ave
- 25 Monroe Dr
- 54 Caldwell Terrace
- 1 Benchley Dr
- 218 Medford Ct Unit A
- 16 Caldwell Terrace
- 22 Alison Ct
- 27 Meadow Ln
Your Personal Tour Guide
Ask me questions while you tour the home.