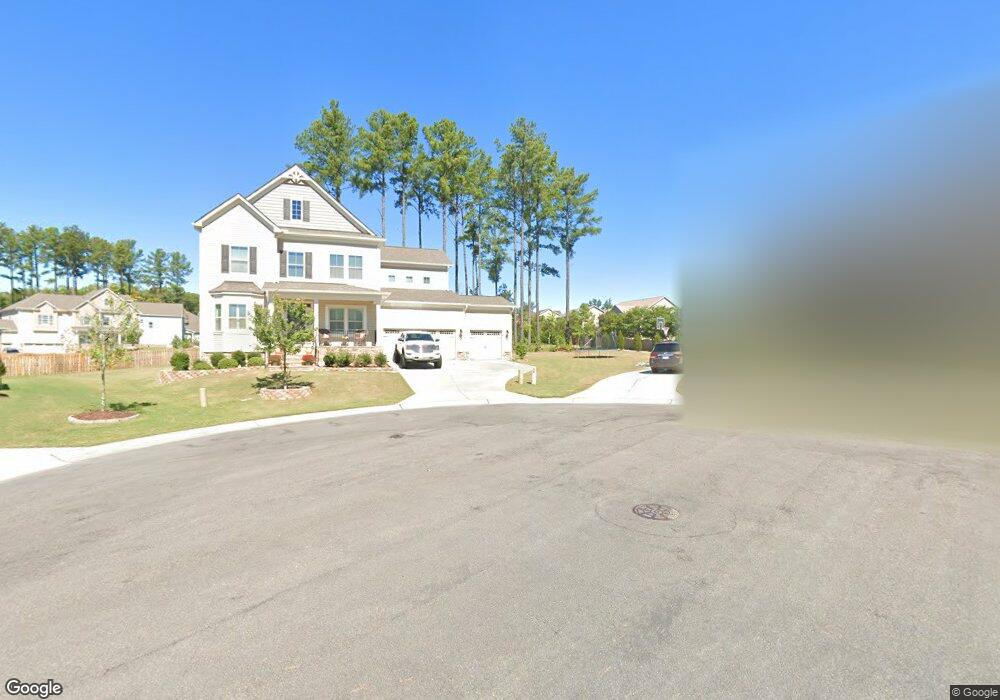
3 Horton Grove Ct Durham, NC 27703
Eastern Durham NeighborhoodEstimated Value: $655,290 - $732,000
4
Beds
3
Baths
3,209
Sq Ft
$218/Sq Ft
Est. Value
About This Home
This home is located at 3 Horton Grove Ct, Durham, NC 27703 and is currently estimated at $698,573, approximately $217 per square foot. 3 Horton Grove Ct is a home located in Durham County with nearby schools including Spring Valley Elementary School, John W Neal Middle School, and Southern School of Energy & Sustainability.
Ownership History
Date
Name
Owned For
Owner Type
Purchase Details
Closed on
Nov 21, 2024
Sold by
Windriver Trust and Lancaster James E
Bought by
Windriver Trust and Lancaster James E
Current Estimated Value
Purchase Details
Closed on
Aug 16, 2024
Sold by
Lancaster James E and Lancaster Lavonne E
Bought by
James E Lancaster E and James Lavonne E
Purchase Details
Closed on
Apr 7, 2017
Sold by
Calatlantic Grp Inc
Bought by
Lancaster James Earl and Lancaster Lavonne E
Home Financials for this Owner
Home Financials are based on the most recent Mortgage that was taken out on this home.
Original Mortgage
$366,249
Interest Rate
4.4%
Mortgage Type
FHA
Purchase Details
Closed on
Sep 25, 2015
Sold by
Mrec Brightleaf Llc
Bought by
The Ryland Group Inc
Create a Home Valuation Report for This Property
The Home Valuation Report is an in-depth analysis detailing your home's value as well as a comparison with similar homes in the area
Home Values in the Area
Average Home Value in this Area
Purchase History
| Date | Buyer | Sale Price | Title Company |
|---|---|---|---|
| Windriver Trust | -- | None Listed On Document | |
| Windriver Trust | -- | None Listed On Document | |
| James E Lancaster E | -- | None Listed On Document | |
| James E Lancaster E | -- | None Listed On Document | |
| Lancaster James Earl | $389,000 | -- | |
| The Ryland Group Inc | $1,248,000 | Attorney |
Source: Public Records
Mortgage History
| Date | Status | Borrower | Loan Amount |
|---|---|---|---|
| Previous Owner | Lancaster James Earl | $366,249 |
Source: Public Records
Tax History Compared to Growth
Tax History
| Year | Tax Paid | Tax Assessment Tax Assessment Total Assessment is a certain percentage of the fair market value that is determined by local assessors to be the total taxable value of land and additions on the property. | Land | Improvement |
|---|---|---|---|---|
| 2025 | $5,525 | $717,382 | $118,125 | $599,257 |
| 2024 | $5,525 | $396,078 | $67,300 | $328,778 |
| 2023 | $5,188 | $396,078 | $67,300 | $328,778 |
| 2022 | $5,069 | $396,078 | $67,300 | $328,778 |
| 2021 | $5,046 | $396,078 | $67,300 | $328,778 |
| 2020 | $4,927 | $396,078 | $67,300 | $328,778 |
| 2019 | $4,927 | $396,078 | $67,300 | $328,778 |
| 2018 | $5,317 | $391,963 | $67,300 | $324,663 |
| 2017 | $906 | $67,300 | $67,300 | $0 |
| 2016 | $876 | $67,300 | $67,300 | $0 |
| 2015 | $1,237 | $89,349 | $89,349 | $0 |
| 2014 | $1,237 | $89,349 | $89,349 | $0 |
Source: Public Records
Map
Nearby Homes
- 4 Seawell Ct
- 1613 Waddell Ct
- 1821 S Mineral Springs Rd
- 3105 Ranger Dr
- CARSON Plan at Copper Run South
- DENVER Plan at Copper Run South
- LANSING Plan at Copper Run South
- 1602 Eagle Lodge Ln
- 3112 Ranger Dr
- 1711 S Miami Blvd
- 1827 Hinesley Rd
- 1819 Hinesley Rd
- 1819 Hinesley Dr
- 1903 Hinesley Rd
- 1913 Hinesley Rd
- 1911 Hinesley Rd
- 1907 Hinesley Rd
- 1901 Hinesley Rd
- 1931 Hinesley Dr
- 1929 Hinesley Dr
- 3 Horton Grove
- 4 Bonsack Ct
- 1 Horton Grove Ct
- 5 Horton Grove Ct
- 5 Horton Grove
- 1923 Pattersons Mill Rd
- 6 Bonsack
- 4 Horton Grove Ct
- 2016 Golden Belt Pkwy
- 2018 Golden Belt Pkwy
- 2 Horton Grove Ct
- 3 Bonsack Ct
- 2014 Golden Belt Pkwy
- 2020 Golden Belt Pkwy
- 1924 Pattersons Mill Rd
- 1924 Patterson's Mill Rd
- 8 Bonsack Ct
- 1926 Pattersons Mill Rd
- 1 Bonsack Ct
- 2012 Golden Belt Pkwy
