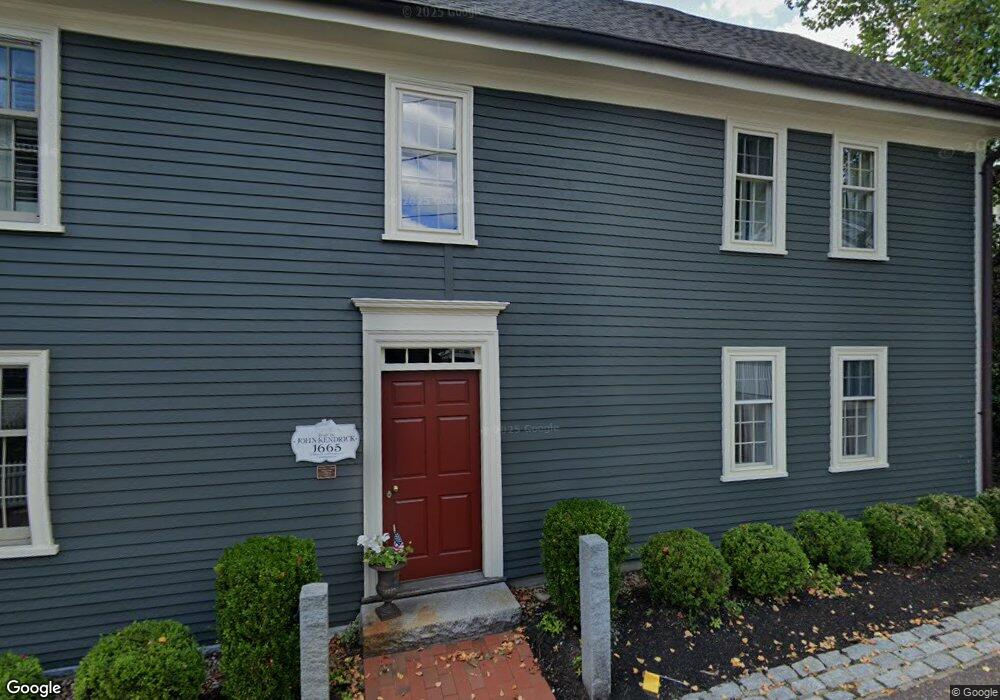
3 Hovey St Ipswich, MA 01938
Estimated Value: $2,587,000 - $2,961,000
5
Beds
6
Baths
6,270
Sq Ft
$431/Sq Ft
Est. Value
About This Home
This home is located at 3 Hovey St, Ipswich, MA 01938 and is currently estimated at $2,704,506, approximately $431 per square foot. 3 Hovey St is a home located in Essex County with nearby schools including Ipswich High School and North Shore Montessori School.
Ownership History
Date
Name
Owned For
Owner Type
Purchase Details
Closed on
Aug 25, 2003
Sold by
Bolka David F and Bolka Carol S
Bought by
Kagan Mark P and Kagan Courtney T
Current Estimated Value
Purchase Details
Closed on
Aug 21, 2000
Sold by
Stone Ft and Wilkish Susan E
Bought by
Bolka David F and Bolka Carol S
Create a Home Valuation Report for This Property
The Home Valuation Report is an in-depth analysis detailing your home's value as well as a comparison with similar homes in the area
Home Values in the Area
Average Home Value in this Area
Purchase History
| Date | Buyer | Sale Price | Title Company |
|---|---|---|---|
| Kagan Mark P | $1,390,000 | -- | |
| Bolka David F | $360,000 | -- |
Source: Public Records
Mortgage History
| Date | Status | Borrower | Loan Amount |
|---|---|---|---|
| Open | Bolka David F | $950,000 | |
| Closed | Bolka David F | $100,000 | |
| Closed | Bolka David F | $250,000 |
Source: Public Records
Tax History Compared to Growth
Tax History
| Year | Tax Paid | Tax Assessment Tax Assessment Total Assessment is a certain percentage of the fair market value that is determined by local assessors to be the total taxable value of land and additions on the property. | Land | Improvement |
|---|---|---|---|---|
| 2025 | $25,951 | $2,327,400 | $455,800 | $1,871,600 |
| 2024 | $24,854 | $2,184,000 | $454,200 | $1,729,800 |
| 2023 | $22,569 | $1,845,400 | $394,700 | $1,450,700 |
| 2022 | $21,965 | $1,708,000 | $394,700 | $1,313,300 |
| 2021 | $21,562 | $1,631,000 | $372,300 | $1,258,700 |
| 2020 | $19,901 | $1,419,500 | $292,300 | $1,127,200 |
| 2019 | $20,118 | $1,427,800 | $292,300 | $1,135,500 |
| 2018 | $19,050 | $1,337,800 | $269,900 | $1,067,900 |
| 2017 | $18,566 | $1,308,400 | $260,600 | $1,047,800 |
| 2016 | $19,431 | $1,308,500 | $260,600 | $1,047,900 |
| 2015 | $17,678 | $1,308,500 | $260,600 | $1,047,900 |
Source: Public Records
Map
Nearby Homes
- 57 East St
- 20 Summer St Unit 20
- 0 Lanes End
- 11 Spillers Ln
- 16 Elm St
- 50 Market St Unit 2
- 50-56 Market St
- 11 Washington St Unit 11
- 11 Washington St
- 11 Washington St Unit 7
- 11 Washington St Unit 5
- 11 Washington St Unit 10
- 11 Washington St Unit 4
- 11 Washington St Unit 12
- 11 Washington St Unit Nine
- 21 Brownville Ave
- 38 Kimball Ave Unit 5
- 128 High St Unit 4
- 23 Jeffrey's Neck Rd
- 500 Colonial Dr Unit 3