Estimated Value: $1,683,394 - $1,978,000
4
Beds
3
Baths
3,982
Sq Ft
$457/Sq Ft
Est. Value
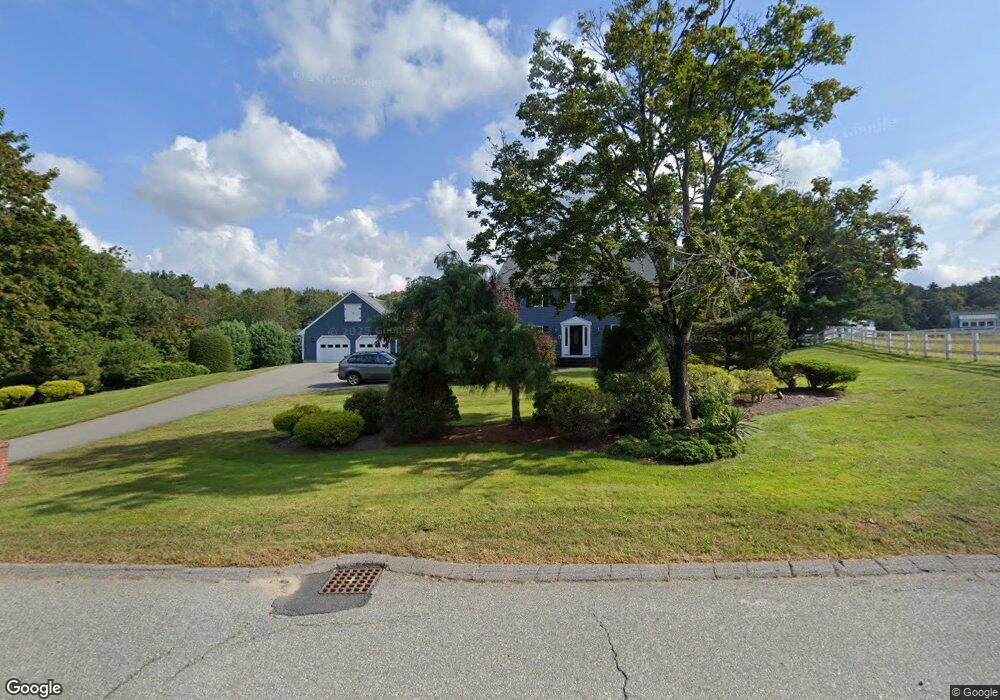
About This Home
This home is located at 3 Hunt Dr, Dover, MA 02030 and is currently estimated at $1,819,099, approximately $456 per square foot. 3 Hunt Dr is a home located in Norfolk County with nearby schools including Chickering Elementary School, Dover-Sherborn Regional Middle School, and Dover-Sherborn Regional High School.
Ownership History
Date
Name
Owned For
Owner Type
Purchase Details
Closed on
Aug 27, 2019
Sold by
Defusco Robert L Est
Bought by
Defusco Jennifer and Defusco Jaclyn
Current Estimated Value
Purchase Details
Closed on
Nov 21, 2018
Sold by
Dover Development Asso
Bought by
Dover Town Of
Purchase Details
Closed on
Aug 4, 1983
Bought by
Defusco Robert L and Defusco Carol C
Create a Home Valuation Report for This Property
The Home Valuation Report is an in-depth analysis detailing your home's value as well as a comparison with similar homes in the area
Home Values in the Area
Average Home Value in this Area
Purchase History
| Date | Buyer | Sale Price | Title Company |
|---|---|---|---|
| Defusco Jennifer | -- | None Available | |
| Dover Town Of | -- | -- | |
| Defusco Robert L | $63,000 | -- |
Source: Public Records
Mortgage History
| Date | Status | Borrower | Loan Amount |
|---|---|---|---|
| Previous Owner | Defusco Robert L | $75,000 | |
| Previous Owner | Defusco Robert L | $75,000 | |
| Previous Owner | Defusco Robert L | $75,000 | |
| Previous Owner | Defusco Robert L | $77,000 |
Source: Public Records
Tax History
| Year | Tax Paid | Tax Assessment Tax Assessment Total Assessment is a certain percentage of the fair market value that is determined by local assessors to be the total taxable value of land and additions on the property. | Land | Improvement |
|---|---|---|---|---|
| 2025 | $16,784 | $1,489,300 | $832,200 | $657,100 |
| 2024 | $15,860 | $1,447,100 | $832,200 | $614,900 |
| 2023 | $15,241 | $1,250,300 | $736,700 | $513,600 |
| 2022 | $14,082 | $1,133,800 | $736,700 | $397,100 |
| 2021 | $14,071 | $1,091,600 | $709,500 | $382,100 |
| 2020 | $14,016 | $1,091,600 | $709,500 | $382,100 |
| 2019 | $14,114 | $1,091,600 | $709,500 | $382,100 |
| 2018 | $13,883 | $1,081,200 | $714,900 | $366,300 |
| 2017 | $14,010 | $1,073,600 | $695,800 | $377,800 |
| 2016 | $13,828 | $1,073,600 | $695,800 | $377,800 |
| 2015 | $12,840 | $1,011,000 | $633,200 | $377,800 |
Source: Public Records
Map
Nearby Homes
Your Personal Tour Guide
Ask me questions while you tour the home.