O
Seller's Agent in 2020
Optima Real Estate Advisors
Coldwell Banker Realty - Worcester
Estimated Value: $547,156 - $703,000
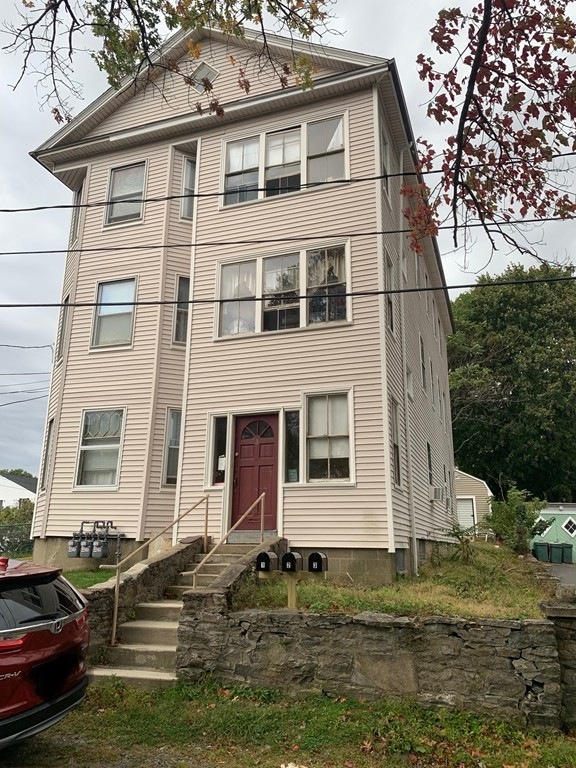
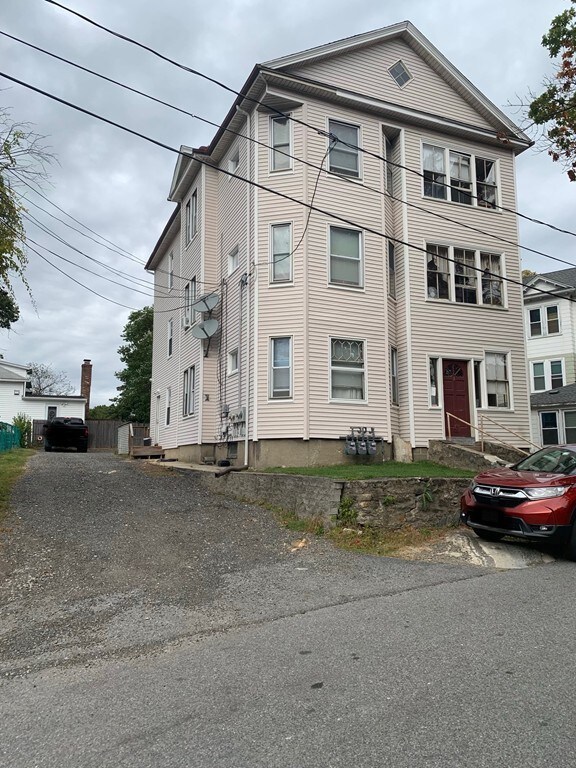
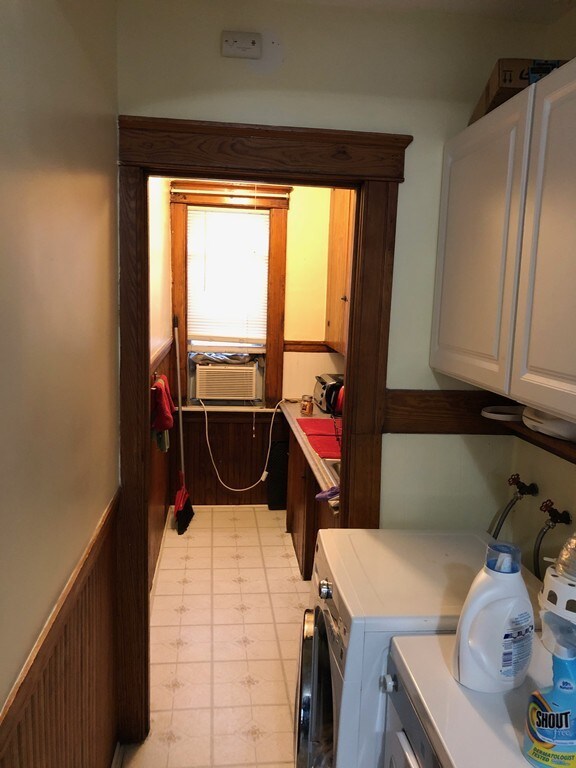
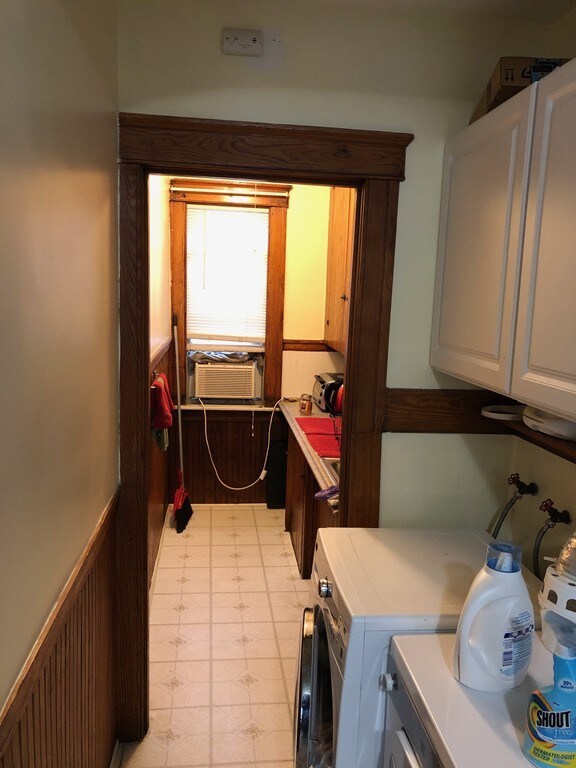
Investors, and Owner Occupied buyers take note. This property is turn key, and fully rented. This large, and well kept three family is tucked off Grafton St, on a quiet lot. Only minutes from downtown Worcester, the Canal District, Shrewsbury st, and has many amenities nearby. This property needs only minor cosmetic upgrades to maximize it's rent potential. The rents are below the average in the area, and 2/3 tenants are MTM. Second floor is a long time tenant, who's lease ends early spring 2020. The total average rents in the area would be around $3k per month for this building.
Last Agent to Sell the Property
Optima Real Estate Advisors
Coldwell Banker Realty - Worcester Listed on: 10/21/2019

| Date | Buyer | Sale Price | Title Company |
|---|---|---|---|
| Dahlgren Sheila M | $110,000 | -- |
| Date | Status | Borrower | Loan Amount |
|---|---|---|---|
| Open | Dahlgren Sheila M | $108,000 | |
| Closed | Dahlgren Sheila M | $105,000 | |
| Closed | Dahlgren Sheila M | $97,137 |
| Date | Event | Price | List to Sale | Price per Sq Ft | Prior Sale |
|---|---|---|---|---|---|
| 01/09/2020 01/09/20 | Sold | $350,000 | -1.4% | $112 / Sq Ft | |
| 11/25/2019 11/25/19 | Pending | -- | -- | -- | |
| 11/07/2019 11/07/19 | Price Changed | $354,900 | -2.7% | $113 / Sq Ft | |
| 10/21/2019 10/21/19 | For Sale | $364,900 | +42.0% | $116 / Sq Ft | |
| 09/01/2017 09/01/17 | Sold | $257,000 | -0.8% | $82 / Sq Ft | View Prior Sale |
| 07/12/2017 07/12/17 | Pending | -- | -- | -- | |
| 07/06/2017 07/06/17 | For Sale | $259,000 | -- | $83 / Sq Ft |
| Year | Tax Paid | Tax Assessment Tax Assessment Total Assessment is a certain percentage of the fair market value that is determined by local assessors to be the total taxable value of land and additions on the property. | Land | Improvement |
|---|---|---|---|---|
| 2025 | $6,925 | $525,000 | $99,000 | $426,000 |
| 2024 | $6,424 | $467,200 | $99,000 | $368,200 |
| 2023 | $6,135 | $427,800 | $86,100 | $341,700 |
| 2022 | $5,330 | $350,400 | $68,900 | $281,500 |
| 2021 | $5,431 | $333,600 | $55,200 | $278,400 |
| 2020 | $5,037 | $296,300 | $55,100 | $241,200 |
| 2019 | $5,042 | $280,100 | $49,600 | $230,500 |
| 2018 | $3,833 | $202,700 | $49,600 | $153,100 |
| 2017 | $3,617 | $188,200 | $49,600 | $138,600 |
| 2016 | $3,413 | $165,600 | $36,900 | $128,700 |
| 2015 | $3,324 | $165,600 | $36,900 | $128,700 |
| 2014 | $3,236 | $165,600 | $36,900 | $128,700 |
O
Seller's Agent in 2020
Optima Real Estate Advisors
Coldwell Banker Realty - Worcester
Seller Co-Listing Agent in 2020
Pete Morris
Sposato Realty Group
(774) 262-0321
27 Total Sales
Buyer's Agent in 2020
Brian O'Neil
Re/Max Vision
(508) 335-9128
2 in this area
74 Total Sales
B
Seller's Agent in 2017
Brian Coomey
The Neighborhood Realty Group
Source: MLS Property Information Network (MLS PIN)
MLS Number: 72582926
APN: WORC-000038-000001-000002
Disclaimer: Certain information contained herein is derived from information provided by parties other than Homes.com. All information provided is deemed reliable, but is not guaranteed to be accurate and should be independently verified.
![]() The property listing data and information, or the Images, set forth herein were provided to MLS Property Information Network, Inc. from third party sources, including sellers, lessors and public records, and were compiled by MLS Property Information Network, Inc. The property listing data and information, and the Images, are for the personal, non-commercial use of consumers having a good faith interest in purchasing or leasing listed properties of the type displayed to them and may not be used for any purpose other than to identify prospective properties which such consumers may have a good faith interest in purchasing or leasing. MLS Property Information Network, Inc. and its subscribers disclaim any and all representations and warranties as to the accuracy of the property listing data and information, or as to the accuracy of any of the Images, set forth herein.
The property listing data and information, or the Images, set forth herein were provided to MLS Property Information Network, Inc. from third party sources, including sellers, lessors and public records, and were compiled by MLS Property Information Network, Inc. The property listing data and information, and the Images, are for the personal, non-commercial use of consumers having a good faith interest in purchasing or leasing listed properties of the type displayed to them and may not be used for any purpose other than to identify prospective properties which such consumers may have a good faith interest in purchasing or leasing. MLS Property Information Network, Inc. and its subscribers disclaim any and all representations and warranties as to the accuracy of the property listing data and information, or as to the accuracy of any of the Images, set forth herein.
Ask me questions while you tour the home.