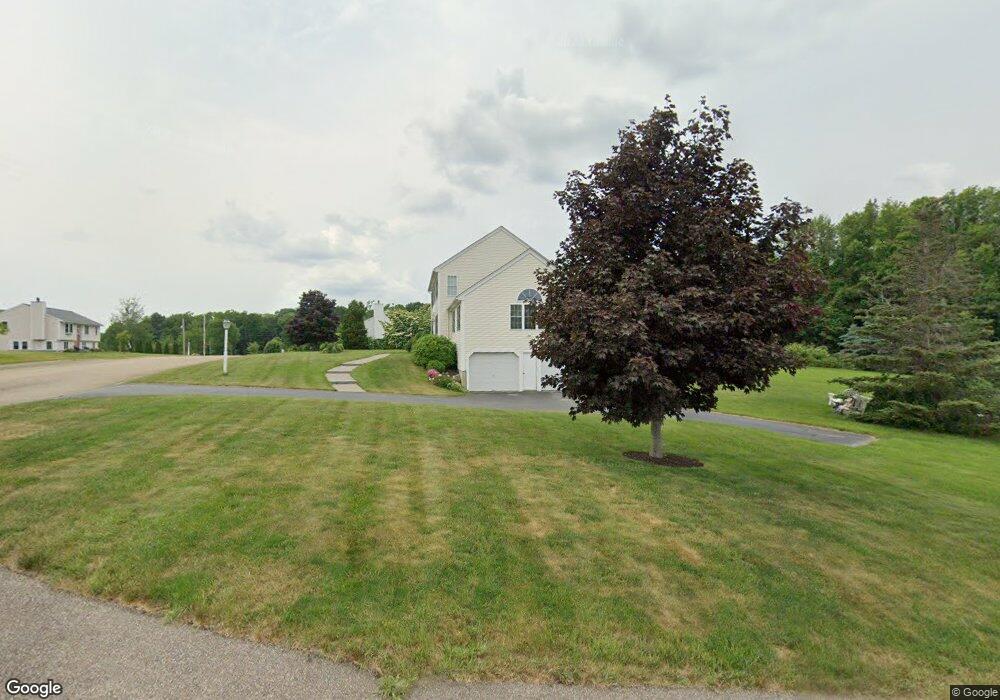
3 Hyland Ave Leicester, MA 01524
Estimated Value: $608,942 - $747,000
4
Beds
3
Baths
2,628
Sq Ft
$252/Sq Ft
Est. Value
About This Home
This home is located at 3 Hyland Ave, Leicester, MA 01524 and is currently estimated at $660,986, approximately $251 per square foot. 3 Hyland Ave is a home located in Worcester County with nearby schools including Leicester Integrated Preschool, Leicester Memorial Elementary School, and Leicester Middle School.
Ownership History
Date
Name
Owned For
Owner Type
Purchase Details
Closed on
Nov 30, 1998
Sold by
Cb Blair Dev Corp
Bought by
Neale Francis A and Neale Patricia E
Current Estimated Value
Home Financials for this Owner
Home Financials are based on the most recent Mortgage that was taken out on this home.
Original Mortgage
$166,542
Outstanding Balance
$37,993
Interest Rate
6.83%
Mortgage Type
Purchase Money Mortgage
Estimated Equity
$622,993
Create a Home Valuation Report for This Property
The Home Valuation Report is an in-depth analysis detailing your home's value as well as a comparison with similar homes in the area
Home Values in the Area
Average Home Value in this Area
Purchase History
| Date | Buyer | Sale Price | Title Company |
|---|---|---|---|
| Neale Francis A | $208,178 | -- |
Source: Public Records
Mortgage History
| Date | Status | Borrower | Loan Amount |
|---|---|---|---|
| Open | Neale Francis A | $166,542 |
Source: Public Records
Tax History Compared to Growth
Tax History
| Year | Tax Paid | Tax Assessment Tax Assessment Total Assessment is a certain percentage of the fair market value that is determined by local assessors to be the total taxable value of land and additions on the property. | Land | Improvement |
|---|---|---|---|---|
| 2025 | $61 | $515,200 | $86,800 | $428,400 |
| 2024 | $5,727 | $456,300 | $74,700 | $381,600 |
| 2023 | $5,420 | $421,500 | $74,700 | $346,800 |
| 2022 | $5,213 | $372,600 | $71,000 | $301,600 |
| 2021 | $5,709 | $377,300 | $78,500 | $298,800 |
| 2020 | $5,329 | $357,400 | $74,400 | $283,000 |
| 2019 | $5,215 | $345,800 | $67,400 | $278,400 |
| 2018 | $4,980 | $309,500 | $67,400 | $242,100 |
| 2017 | $4,791 | $309,500 | $67,400 | $242,100 |
| 2016 | $4,531 | $304,100 | $71,000 | $233,100 |
| 2015 | $4,422 | $304,100 | $71,000 | $233,100 |
Source: Public Records
Map
Nearby Homes
- 27 Winslow Ave
- Lot B Paxton St
- Lot A Paxton St
- 0 S Main St Unit 73392435
- 56 Lake Sargent Dr
- 0 Hawthorne St Unit 73444632
- 1569 Main St
- 1326 Main St
- 80 Rawson St
- 1472 Main St
- 390 Marshall St
- 350 Marshall St
- 500 Main St
- 19 South St
- 23 South St
- 135 Henshaw St
- 18 Brown St
- 502 Pine St
- 19 Laurelwood Ave
- 5 Woodland Dr
- 1 Hyland Ave
- 51 William Cir
- 4 Hyland Ave
- 2 William Cir
- 6 William Cir
- 2 Hyland Ave
- 218 Paxton St
- 6 Hyland Ave
- 7 Hyland Ave
- Lot 0 Route 56
- 0 Route 56 Unit 71612111
- 0 Route 56 Unit 71612109
- 0 Route 56 Unit 71940327
- 0 Route 56 Unit 72580403
- 220 Paxton St
- 217 Paxton St
- 224 Paxton St
- 9 Hyland Ave
- 8 Hyland Ave
- 2 Whittemore St