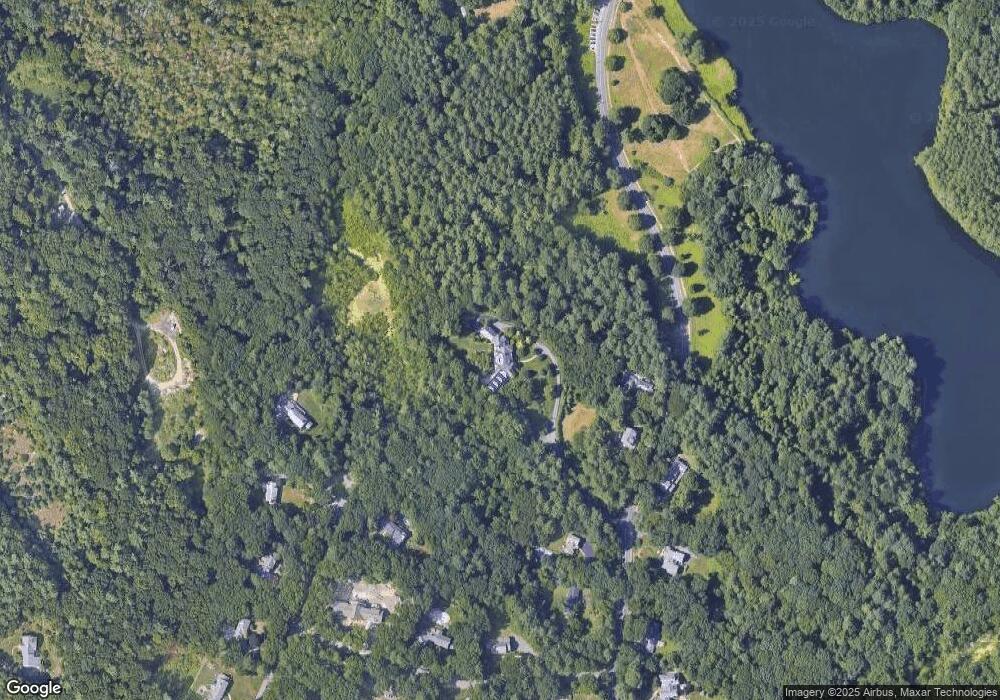
3 Idlewile Ln Weston, MA 02493
Estimated Value: $4,061,000 - $12,019,069
6
Beds
11
Baths
14,620
Sq Ft
$550/Sq Ft
Est. Value
About This Home
This home is located at 3 Idlewile Ln, Weston, MA 02493 and is currently estimated at $8,040,035, approximately $549 per square foot. 3 Idlewile Ln is a home located in Middlesex County with nearby schools including Country Elementary School, Woodland Elementary School, and Field Elementary School.
Ownership History
Date
Name
Owned For
Owner Type
Purchase Details
Closed on
Apr 30, 2010
Sold by
Wallack Lisa
Bought by
Wallack Lisa and Wallack Neil A
Current Estimated Value
Home Financials for this Owner
Home Financials are based on the most recent Mortgage that was taken out on this home.
Original Mortgage
$6,000,000
Outstanding Balance
$4,009,724
Interest Rate
4.99%
Mortgage Type
Purchase Money Mortgage
Estimated Equity
$4,030,311
Purchase Details
Closed on
Apr 22, 2008
Sold by
Wile Evan
Bought by
Wallack Lisa
Home Financials for this Owner
Home Financials are based on the most recent Mortgage that was taken out on this home.
Original Mortgage
$1,000,000
Interest Rate
6.1%
Mortgage Type
Purchase Money Mortgage
Create a Home Valuation Report for This Property
The Home Valuation Report is an in-depth analysis detailing your home's value as well as a comparison with similar homes in the area
Home Values in the Area
Average Home Value in this Area
Purchase History
| Date | Buyer | Sale Price | Title Company |
|---|---|---|---|
| Wallack Lisa | -- | -- | |
| Wallack Lisa | $1,675,000 | -- | |
| Wallack Lisa | $1,675,000 | -- |
Source: Public Records
Mortgage History
| Date | Status | Borrower | Loan Amount |
|---|---|---|---|
| Open | Wallack Lisa | $6,000,000 | |
| Previous Owner | Wallack Lisa | $1,000,000 |
Source: Public Records
Tax History
| Year | Tax Paid | Tax Assessment Tax Assessment Total Assessment is a certain percentage of the fair market value that is determined by local assessors to be the total taxable value of land and additions on the property. | Land | Improvement |
|---|---|---|---|---|
| 2025 | $146,406 | $13,189,700 | $2,668,400 | $10,521,300 |
| 2024 | $142,776 | $12,839,600 | $2,668,400 | $10,171,200 |
| 2023 | $141,476 | $11,949,000 | $2,668,400 | $9,280,600 |
| 2022 | $134,400 | $10,491,800 | $2,477,700 | $8,014,100 |
| 2021 | $130,539 | $10,056,900 | $2,391,300 | $7,665,600 |
| 2020 | $131,196 | $10,225,700 | $2,391,300 | $7,834,400 |
| 2019 | $129,520 | $10,287,500 | $2,391,300 | $7,896,200 |
| 2018 | $129,750 | $10,371,700 | $2,391,300 | $7,980,400 |
| 2017 | $129,652 | $10,455,800 | $2,391,300 | $8,064,500 |
| 2016 | $128,168 | $10,540,100 | $2,391,300 | $8,148,800 |
| 2015 | $126,633 | $10,312,100 | $2,310,300 | $8,001,800 |
Source: Public Records
Map
Nearby Homes
Your Personal Tour Guide
Ask me questions while you tour the home.