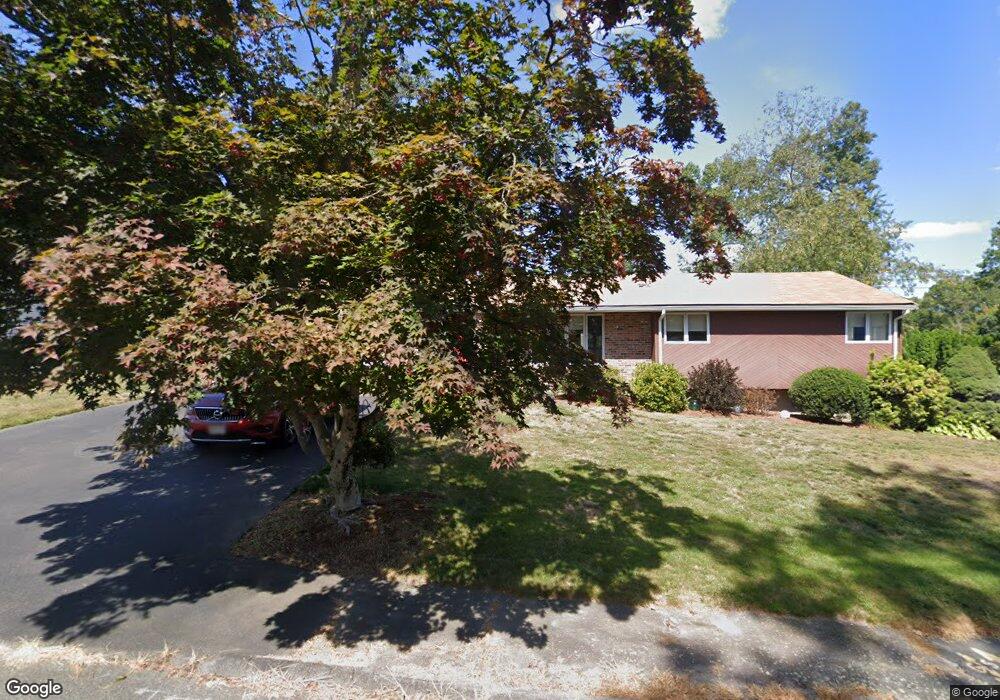
3 Imrie St Randolph, MA 02368
North Randolph NeighborhoodEstimated Value: $614,000 - $684,000
3
Beds
2
Baths
1,579
Sq Ft
$405/Sq Ft
Est. Value
About This Home
This home is located at 3 Imrie St, Randolph, MA 02368 and is currently estimated at $639,015, approximately $404 per square foot. 3 Imrie St is a home located in Norfolk County with nearby schools including Randolph High School.
Ownership History
Date
Name
Owned For
Owner Type
Purchase Details
Closed on
Apr 14, 2025
Sold by
Macleod Allan D and Macleod Donna M
Bought by
Macleod Ft and Macleod
Current Estimated Value
Purchase Details
Closed on
Nov 3, 2020
Sold by
Macleod Allan D and Macleod Donna M
Bought by
Macleod Allan D and Macleod Donna M
Purchase Details
Closed on
Aug 18, 1986
Bought by
Macleod Allan D and Macleod Donna M S
Create a Home Valuation Report for This Property
The Home Valuation Report is an in-depth analysis detailing your home's value as well as a comparison with similar homes in the area
Home Values in the Area
Average Home Value in this Area
Purchase History
| Date | Buyer | Sale Price | Title Company |
|---|---|---|---|
| Macleod Ft | -- | None Available | |
| Macleod Allan D | -- | None Available | |
| Macleod Allan D | $155,000 | -- |
Source: Public Records
Mortgage History
| Date | Status | Borrower | Loan Amount |
|---|---|---|---|
| Previous Owner | Macleod Allan D | $160,000 | |
| Previous Owner | Macleod Allan D | $40,000 |
Source: Public Records
Tax History
| Year | Tax Paid | Tax Assessment Tax Assessment Total Assessment is a certain percentage of the fair market value that is determined by local assessors to be the total taxable value of land and additions on the property. | Land | Improvement |
|---|---|---|---|---|
| 2025 | $6,723 | $579,100 | $253,300 | $325,800 |
| 2024 | $6,240 | $545,000 | $248,300 | $296,700 |
| 2023 | $6,044 | $500,300 | $225,700 | $274,600 |
| 2022 | $5,917 | $435,100 | $188,200 | $246,900 |
| 2021 | $6,091 | $412,100 | $156,800 | $255,300 |
| 2020 | $5,904 | $396,000 | $156,800 | $239,200 |
| 2019 | $5,665 | $378,200 | $149,300 | $228,900 |
| 2018 | $5,445 | $342,900 | $135,700 | $207,200 |
| 2017 | $5,077 | $313,800 | $129,200 | $184,600 |
| 2016 | $4,947 | $284,500 | $117,500 | $167,000 |
| 2015 | $4,806 | $265,500 | $112,000 | $153,500 |
Source: Public Records
Map
Nearby Homes
- 902 Irving Rd Unit 902
- 232 Canton St Unit 308
- 232 Canton St Unit 104
- 10 Michael Rd
- 33 Michael Rd
- 4 Franklin Square Unit 4F
- 195 High St
- 51 Himoor Cir
- 26 Pauline St
- 72 Canton St
- 79 Gold St
- 23 Old St
- 140 York St
- 9 Royal Crest Dr Unit 12
- 43 Emily Jeffers Rd
- 20 Simmonds Blvd Unit 20
- 18 Simmonds Blvd Unit 18
- 8 Simmonds Blvd Unit 8
- 22 Simmonds Blvd Unit 22
- 10 Simmonds Blvd Unit 10
Your Personal Tour Guide
Ask me questions while you tour the home.