Estimated Value: $575,000 - $738,000
3
Beds
3
Baths
1,904
Sq Ft
$347/Sq Ft
Est. Value
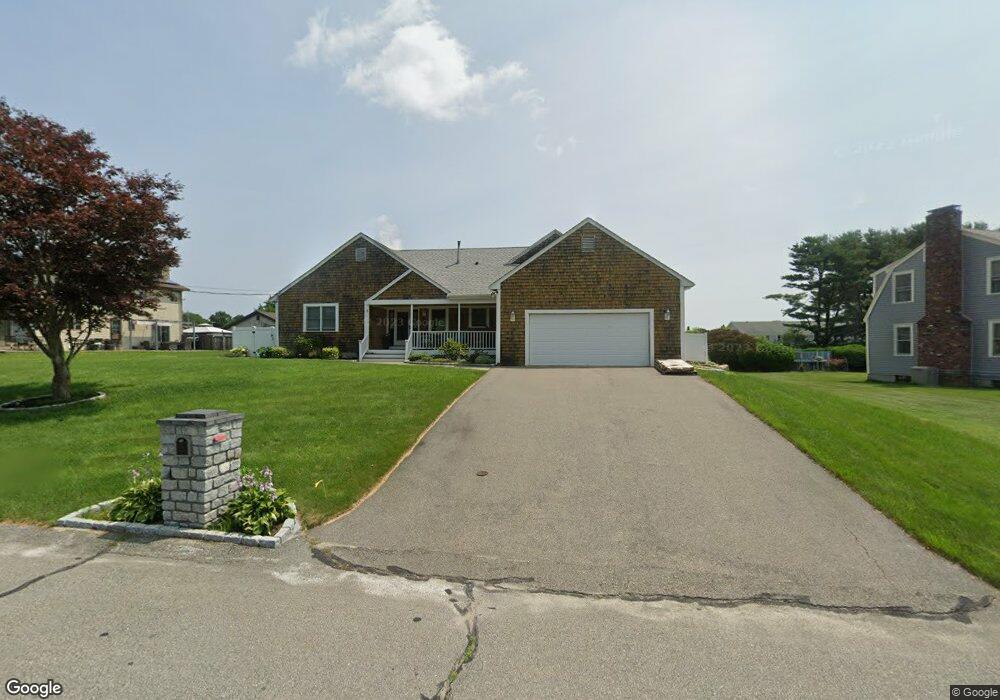
About This Home
This home is located at 3 Jacob Dr, North Dartmouth, MA 02747 and is currently estimated at $661,081, approximately $347 per square foot. 3 Jacob Dr is a home located in Bristol County with nearby schools including Dartmouth High School, Our Sister's School, and Bishop Stang High School.
Ownership History
Date
Name
Owned For
Owner Type
Purchase Details
Closed on
Jan 7, 2008
Sold by
Pinto Betty Jean and Steiblin Betty Jean
Bought by
Pinto Betty Jean
Current Estimated Value
Purchase Details
Closed on
Nov 1, 1993
Sold by
Franica Inez and Aguiar George L
Bought by
Steiblin Louis M and Steiblin Betty Jean
Create a Home Valuation Report for This Property
The Home Valuation Report is an in-depth analysis detailing your home's value as well as a comparison with similar homes in the area
Home Values in the Area
Average Home Value in this Area
Purchase History
| Date | Buyer | Sale Price | Title Company |
|---|---|---|---|
| Pinto Betty Jean | -- | -- | |
| Steiblin Louis M | $52,500 | -- |
Source: Public Records
Mortgage History
| Date | Status | Borrower | Loan Amount |
|---|---|---|---|
| Open | Steiblin Louis M | $112,000 | |
| Previous Owner | Steiblin Louis M | $130,000 | |
| Previous Owner | Steiblin Louis M | $900,000 |
Source: Public Records
Tax History Compared to Growth
Tax History
| Year | Tax Paid | Tax Assessment Tax Assessment Total Assessment is a certain percentage of the fair market value that is determined by local assessors to be the total taxable value of land and additions on the property. | Land | Improvement |
|---|---|---|---|---|
| 2025 | $5,113 | $593,900 | $187,100 | $406,800 |
| 2024 | $4,400 | $506,300 | $173,100 | $333,200 |
| 2023 | $4,310 | $470,000 | $167,500 | $302,500 |
| 2022 | $4,178 | $422,000 | $167,500 | $254,500 |
| 2021 | $4,202 | $405,600 | $155,800 | $249,800 |
| 2020 | $4,013 | $386,600 | $147,700 | $238,900 |
| 2019 | $3,918 | $376,700 | $140,900 | $235,800 |
| 2018 | $3,687 | $364,700 | $154,500 | $210,200 |
| 2017 | $3,529 | $352,200 | $145,800 | $206,400 |
| 2016 | $3,390 | $333,700 | $139,400 | $194,300 |
| 2015 | $3,312 | $326,600 | $130,300 | $196,300 |
| 2014 | $3,235 | $316,800 | $124,700 | $192,100 |
Source: Public Records
Map
Nearby Homes
- 6 Jacob Dr
- 5 Samosett Dr
- 3 Mishawum Dr
- 33 Rosewood Terrace
- 29 Elizabeth Ct
- 212 Rockland St
- 360 Russells Mills Rd
- 21 Avis St
- 6 Walters Way
- 179 Rockland St
- 25 Westwood Dr
- 98 Mccabe St
- 48 Wilson St
- 76 Shipyard Ln
- 75 Country Way Unit 75
- 34 Country Way
- 1004 Allen St
- 32 Fulton St
- 15 Puritan St
- 0 Victoria St Unit 73457953