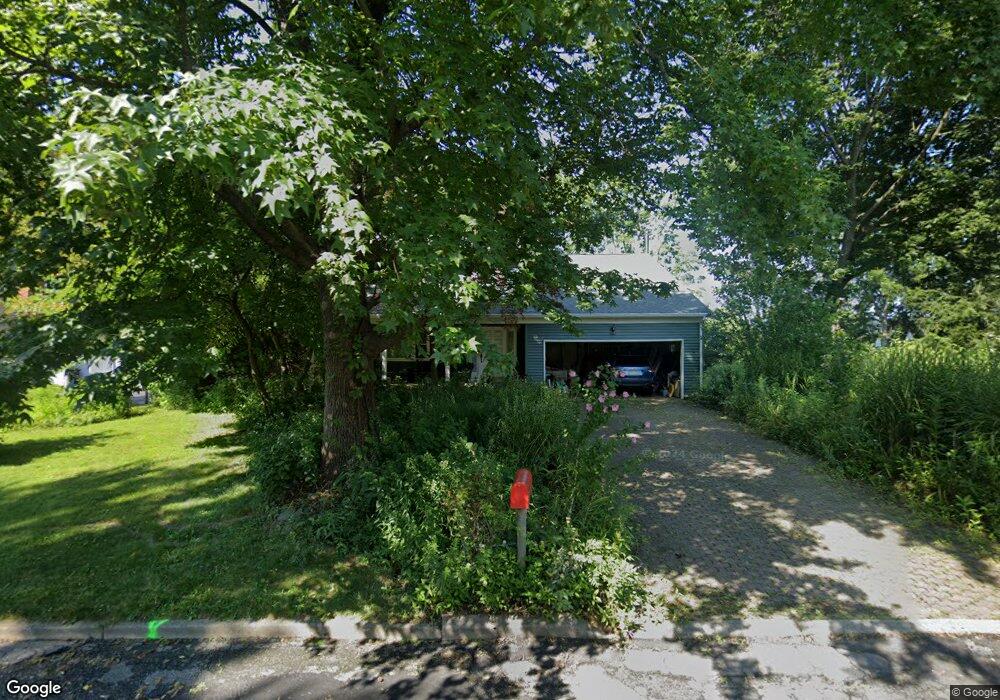
3 Jane Ln High Bridge, NJ 08829
Estimated Value: $570,915 - $634,000
Studio
--
Bath
2,086
Sq Ft
$293/Sq Ft
Est. Value
About This Home
This home is located at 3 Jane Ln, High Bridge, NJ 08829 and is currently estimated at $611,729, approximately $293 per square foot. 3 Jane Ln is a home located in Hunterdon County with nearby schools including High Bridge Elementary School, High Bridge Middle School, and Voorhees High School.
Ownership History
Date
Name
Owned For
Owner Type
Purchase Details
Closed on
Dec 9, 1992
Sold by
Citicorp Mortgage Inc
Bought by
Persinko James J and Persinko Roselle P
Current Estimated Value
Purchase Details
Closed on
Sep 15, 1992
Sold by
Marino James Sheriff
Bought by
Citicorp Mortgage Inc
Purchase Details
Closed on
Aug 24, 1988
Sold by
Miller Ricardo and Miller Renate
Bought by
Turek Joseph C and Turek Brenda S
Create a Home Valuation Report for This Property
The Home Valuation Report is an in-depth analysis detailing your home's value as well as a comparison with similar homes in the area
Home Values in the Area
Average Home Value in this Area
Purchase History
| Date | Buyer | Sale Price | Title Company |
|---|---|---|---|
| Persinko James J | $193,000 | -- | |
| Citicorp Mortgage Inc | $100 | -- | |
| Turek Joseph C | $219,000 | -- |
Source: Public Records
Tax History
| Year | Tax Paid | Tax Assessment Tax Assessment Total Assessment is a certain percentage of the fair market value that is determined by local assessors to be the total taxable value of land and additions on the property. | Land | Improvement |
|---|---|---|---|---|
| 2025 | $14,969 | $464,200 | $203,000 | $261,200 |
| 2024 | $14,899 | $458,600 | $143,000 | $315,600 |
Source: Public Records
Map
Nearby Homes
Your Personal Tour Guide
Ask me questions while you tour the home.