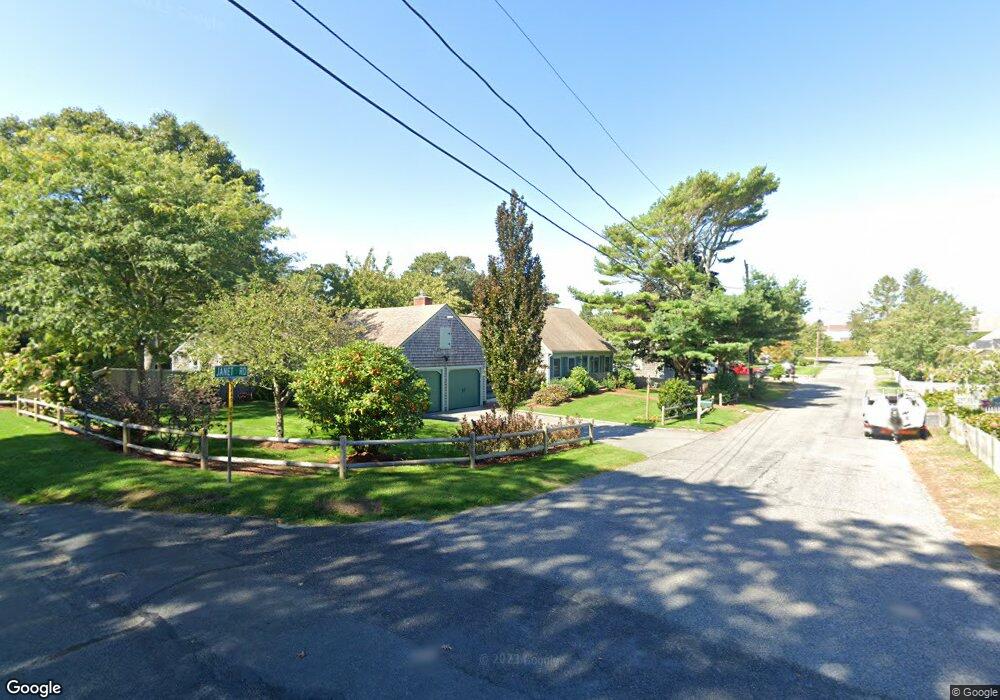
3 Janet Rd West Dennis, MA 02670
West Dennis NeighborhoodEstimated Value: $814,884 - $894,000
5
Beds
2
Baths
1,801
Sq Ft
$479/Sq Ft
Est. Value
About This Home
This home is located at 3 Janet Rd, West Dennis, MA 02670 and is currently estimated at $862,221, approximately $478 per square foot. 3 Janet Rd is a home located in Barnstable County with nearby schools including Dennis-Yarmouth Regional High School and St. Pius X. School.
Ownership History
Date
Name
Owned For
Owner Type
Purchase Details
Closed on
Jan 18, 2007
Sold by
Obrien Diane M and Wall Diane Obrien
Bought by
Wall Dianne Obrien and Wall Gerald A
Current Estimated Value
Purchase Details
Closed on
Dec 19, 1994
Sold by
James F Macgregor T and Macgregor James F
Bought by
Obrien Diane M
Home Financials for this Owner
Home Financials are based on the most recent Mortgage that was taken out on this home.
Original Mortgage
$148,000
Interest Rate
9.03%
Mortgage Type
Purchase Money Mortgage
Create a Home Valuation Report for This Property
The Home Valuation Report is an in-depth analysis detailing your home's value as well as a comparison with similar homes in the area
Home Values in the Area
Average Home Value in this Area
Purchase History
| Date | Buyer | Sale Price | Title Company |
|---|---|---|---|
| Wall Dianne Obrien | -- | -- | |
| Obrien Diane M | $156,000 | -- |
Source: Public Records
Mortgage History
| Date | Status | Borrower | Loan Amount |
|---|---|---|---|
| Previous Owner | Obrien Diane M | $147,000 | |
| Previous Owner | Obrien Diane M | $148,000 | |
| Previous Owner | Obrien Diane M | $159,000 |
Source: Public Records
Tax History Compared to Growth
Tax History
| Year | Tax Paid | Tax Assessment Tax Assessment Total Assessment is a certain percentage of the fair market value that is determined by local assessors to be the total taxable value of land and additions on the property. | Land | Improvement |
|---|---|---|---|---|
| 2025 | $3,401 | $785,500 | $146,900 | $638,600 |
| 2024 | $3,303 | $752,400 | $141,300 | $611,100 |
| 2023 | $3,194 | $683,900 | $128,400 | $555,500 |
| 2022 | $3,017 | $538,700 | $127,300 | $411,400 |
| 2021 | $8,845 | $480,700 | $124,800 | $355,900 |
| 2020 | $2,876 | $471,500 | $136,100 | $335,400 |
| 2019 | $8,603 | $388,500 | $111,200 | $277,300 |
| 2018 | $7,980 | $423,800 | $158,800 | $265,000 |
| 2017 | $3,429 | $392,000 | $127,000 | $265,000 |
| 2016 | $2,524 | $386,500 | $142,900 | $243,600 |
| 2015 | $2,474 | $386,500 | $142,900 | $243,600 |
| 2014 | $2,377 | $374,300 | $142,900 | $231,400 |
Source: Public Records
Map
Nearby Homes
- 14 Schoolhouse Ln
- 209 Main St Unit 3
- 209 Main St Unit 6
- 209 Main St Unit 1
- 209 Main St Unit 2
- 209 Main St Unit 4
- 209 Main St Unit 5
- 23 Doric Ave
- 401 Main St Unit 201
- 401 Main St Unit 101
- 178 School St
- 467 Main St
- 2 Rita Mary Way
- 428 Main St Unit 1-11
- 45 Seth Ln
- 40 Kelley Rd
- 308 Old Main St
- 29 Bass River Rd
- 18 Turner Ln
- 61 Trotters Ln