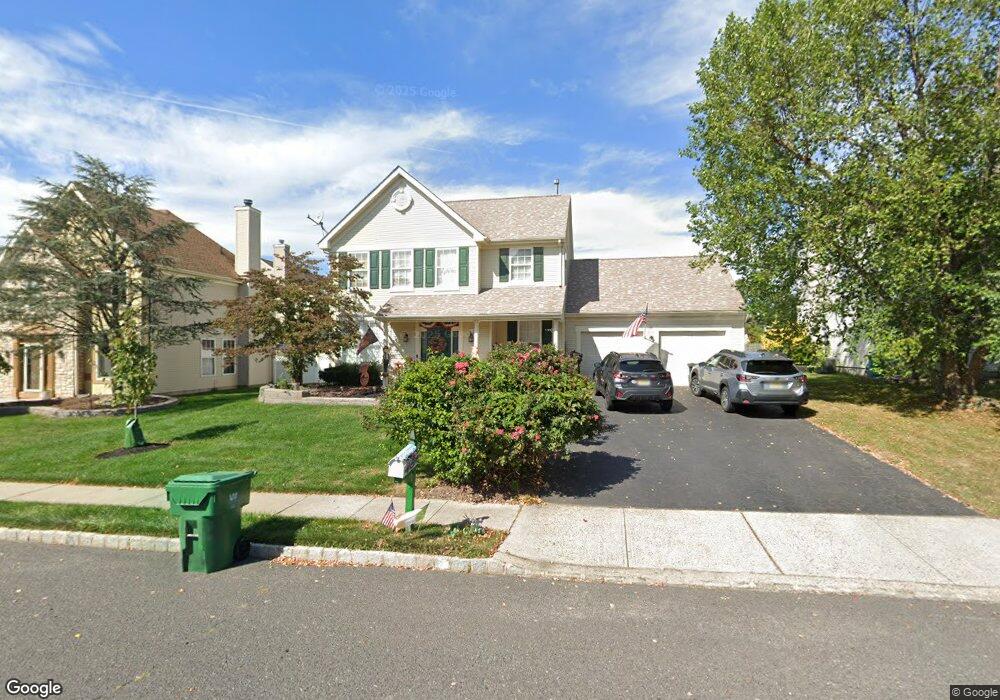
3 Jared Ct Howell, NJ 07731
Salem Hill NeighborhoodEstimated Value: $730,000 - $846,000
3
Beds
2
Baths
1,731
Sq Ft
$443/Sq Ft
Est. Value
About This Home
This home is located at 3 Jared Ct, Howell, NJ 07731 and is currently estimated at $766,196, approximately $442 per square foot. 3 Jared Ct is a home located in Monmouth County with nearby schools including Land O' Pines School, Newbury School, and Howell Middle School North.
Ownership History
Date
Name
Owned For
Owner Type
Purchase Details
Closed on
Aug 12, 2002
Sold by
Bremner Marguerite
Bought by
Londregan Steven and Londregan Anne
Current Estimated Value
Home Financials for this Owner
Home Financials are based on the most recent Mortgage that was taken out on this home.
Original Mortgage
$252,400
Outstanding Balance
$105,351
Interest Rate
6.36%
Estimated Equity
$660,845
Purchase Details
Closed on
Jan 21, 1999
Sold by
Hadginikitas John
Bought by
Bremner Marguerite
Purchase Details
Closed on
Jan 31, 1995
Sold by
Calton Homes Inc
Bought by
Hadginikitas John and Hadginikitas Linda
Create a Home Valuation Report for This Property
The Home Valuation Report is an in-depth analysis detailing your home's value as well as a comparison with similar homes in the area
Home Values in the Area
Average Home Value in this Area
Purchase History
| Date | Buyer | Sale Price | Title Company |
|---|---|---|---|
| Londregan Steven | $316,500 | -- | |
| Bremner Marguerite | $187,000 | -- | |
| Hadginikitas John | $164,740 | -- |
Source: Public Records
Mortgage History
| Date | Status | Borrower | Loan Amount |
|---|---|---|---|
| Open | Londregan Steven | $252,400 |
Source: Public Records
Tax History
| Year | Tax Paid | Tax Assessment Tax Assessment Total Assessment is a certain percentage of the fair market value that is determined by local assessors to be the total taxable value of land and additions on the property. | Land | Improvement |
|---|---|---|---|---|
| 2025 | $10,069 | $640,900 | $390,500 | $250,400 |
| 2024 | $9,037 | $566,300 | $320,500 | $245,800 |
| 2023 | $9,037 | $485,600 | $245,500 | $240,100 |
| 2022 | $8,392 | $472,900 | $225,500 | $247,400 |
| 2021 | $8,392 | $365,500 | $145,500 | $220,000 |
| 2020 | $8,663 | $373,100 | $155,500 | $217,600 |
| 2019 | $8,738 | $369,300 | $155,500 | $213,800 |
| 2018 | $8,557 | $359,400 | $155,500 | $203,900 |
| 2017 | $8,505 | $353,200 | $155,500 | $197,700 |
| 2016 | $7,860 | $323,200 | $130,500 | $192,700 |
| 2015 | $6,894 | $280,600 | $90,500 | $190,100 |
| 2014 | $8,066 | $304,600 | $146,000 | $158,600 |
Source: Public Records
Map
Nearby Homes
Your Personal Tour Guide
Ask me questions while you tour the home.