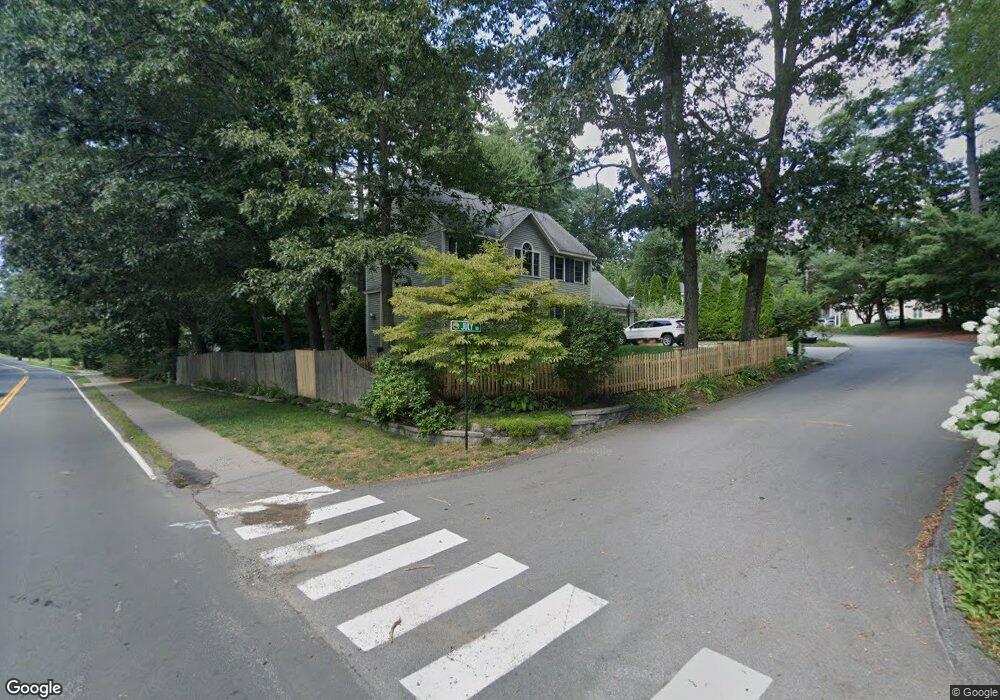
3 July Rd Sudbury, MA 01776
Estimated Value: $1,028,000 - $1,192,536
3
Beds
3
Baths
3,275
Sq Ft
$339/Sq Ft
Est. Value
About This Home
This home is located at 3 July Rd, Sudbury, MA 01776 and is currently estimated at $1,110,134, approximately $338 per square foot. 3 July Rd is a home located in Middlesex County with nearby schools including General John Nixon Elementary School, Ephraim Curtis Middle School, and Lincoln-Sudbury Regional High School.
Ownership History
Date
Name
Owned For
Owner Type
Purchase Details
Closed on
Sep 1, 2021
Sold by
Reinhardt Jacob A and Barry Katherine M
Bought by
Katherine M Barry T
Current Estimated Value
Purchase Details
Closed on
Jun 24, 2010
Sold by
Lustig Mark Stuart and Hawk-Lustig Marjorie
Bought by
Reinhardt Jacob A and Barry Katherine M
Home Financials for this Owner
Home Financials are based on the most recent Mortgage that was taken out on this home.
Original Mortgage
$496,935
Interest Rate
5.5%
Mortgage Type
FHA
Purchase Details
Closed on
Jun 30, 1999
Sold by
Hamblin Homes Rt 2 and Curley
Bought by
Lustig Mark S and Lustig Marjorie H
Home Financials for this Owner
Home Financials are based on the most recent Mortgage that was taken out on this home.
Original Mortgage
$240,000
Interest Rate
7.19%
Mortgage Type
Purchase Money Mortgage
Create a Home Valuation Report for This Property
The Home Valuation Report is an in-depth analysis detailing your home's value as well as a comparison with similar homes in the area
Home Values in the Area
Average Home Value in this Area
Purchase History
| Date | Buyer | Sale Price | Title Company |
|---|---|---|---|
| Katherine M Barry T | -- | None Available | |
| Katherine M Barry T M | -- | None Available | |
| Reinhardt Jacob A | $540,000 | -- | |
| Reinhardt Jacob A | $540,000 | -- | |
| Lustig Mark S | $339,900 | -- |
Source: Public Records
Mortgage History
| Date | Status | Borrower | Loan Amount |
|---|---|---|---|
| Previous Owner | Reinhardt Jacob A | $496,935 | |
| Previous Owner | Lustig Mark S | $240,000 | |
| Closed | Lustig Mark S | $65,910 |
Source: Public Records
Tax History Compared to Growth
Tax History
| Year | Tax Paid | Tax Assessment Tax Assessment Total Assessment is a certain percentage of the fair market value that is determined by local assessors to be the total taxable value of land and additions on the property. | Land | Improvement |
|---|---|---|---|---|
| 2025 | $14,640 | $1,000,000 | $360,800 | $639,200 |
| 2024 | $14,091 | $964,500 | $350,300 | $614,200 |
| 2023 | $13,129 | $832,500 | $318,300 | $514,200 |
| 2022 | $12,785 | $708,300 | $292,200 | $416,100 |
| 2021 | $11,951 | $634,700 | $292,200 | $342,500 |
| 2020 | $11,710 | $634,700 | $292,200 | $342,500 |
| 2019 | $11,367 | $634,700 | $292,200 | $342,500 |
| 2018 | $11,226 | $626,100 | $295,600 | $330,500 |
| 2017 | $10,869 | $612,700 | $285,400 | $327,300 |
| 2016 | $10,543 | $592,300 | $274,500 | $317,800 |
| 2015 | $10,085 | $573,000 | $261,600 | $311,400 |
| 2014 | $10,052 | $557,500 | $252,400 | $305,100 |
Source: Public Records
Map
Nearby Homes
- 36 Old Forge Ln
- 47 Fairbank Rd
- 4 Elderberry Cir
- 12 Camperdown Ln
- 24 Goodnow Rd
- 54 Phillips Rd
- 14 Tanbark Rd
- 55 Widow Rites Ln
- 45 Widow Rites Ln
- 21 Summer St
- 7 Saddle Ridge Rd
- 63 Canterbury Dr
- 270 Old Lancaster Rd
- 5 Taintor Dr
- 166 Parker St Unit 4
- 89 Bridle Path
- 25 Bridle Path
- 30 Rolling Ln
- 427 Concord Rd
- 12 Hickory Rd