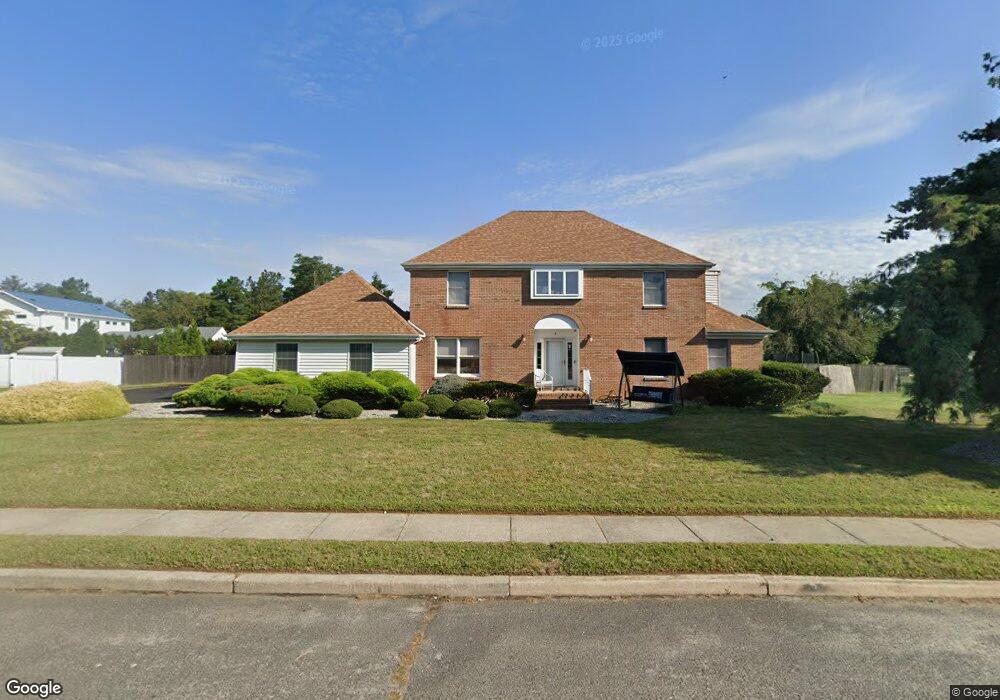
3 Kastor Ln West Long Branch, NJ 07764
Estimated Value: $1,511,000 - $1,657,000
4
Beds
3
Baths
2,505
Sq Ft
$639/Sq Ft
Est. Value
About This Home
This home is located at 3 Kastor Ln, West Long Branch, NJ 07764 and is currently estimated at $1,601,714, approximately $639 per square foot. 3 Kastor Ln is a home located in Monmouth County with nearby schools including Betty McElmon Elementary School, Frank Antonides School, and Shore Regional High School.
Ownership History
Date
Name
Owned For
Owner Type
Purchase Details
Closed on
Dec 19, 2008
Sold by
Harari Cindy
Bought by
Harari Fred and Harari Cindy
Current Estimated Value
Create a Home Valuation Report for This Property
The Home Valuation Report is an in-depth analysis detailing your home's value as well as a comparison with similar homes in the area
Home Values in the Area
Average Home Value in this Area
Purchase History
| Date | Buyer | Sale Price | Title Company |
|---|---|---|---|
| Harari Fred | -- | None Available |
Source: Public Records
Tax History Compared to Growth
Tax History
| Year | Tax Paid | Tax Assessment Tax Assessment Total Assessment is a certain percentage of the fair market value that is determined by local assessors to be the total taxable value of land and additions on the property. | Land | Improvement |
|---|---|---|---|---|
| 2025 | $17,056 | $1,309,000 | $1,038,300 | $270,700 |
| 2024 | $18,287 | $1,309,000 | $1,036,400 | $272,600 |
| 2023 | $18,287 | $1,309,000 | $940,800 | $368,200 |
| 2022 | $13,131 | $1,000,600 | $548,200 | $452,400 |
| 2021 | $13,131 | $679,300 | $315,100 | $364,200 |
| 2020 | $13,442 | $654,100 | $298,200 | $355,900 |
| 2019 | $13,329 | $652,100 | $298,200 | $353,900 |
| 2018 | $14,093 | $666,000 | $305,300 | $360,700 |
| 2017 | $13,739 | $620,000 | $270,300 | $349,700 |
| 2016 | $13,275 | $611,200 | $270,300 | $340,900 |
| 2015 | $13,102 | $602,400 | $270,300 | $332,100 |
| 2014 | $12,517 | $537,000 | $220,300 | $316,700 |
Source: Public Records
Map
Nearby Homes