Estimated Value: $316,681 - $385,000
3
Beds
2
Baths
1,664
Sq Ft
$208/Sq Ft
Est. Value
About This Home
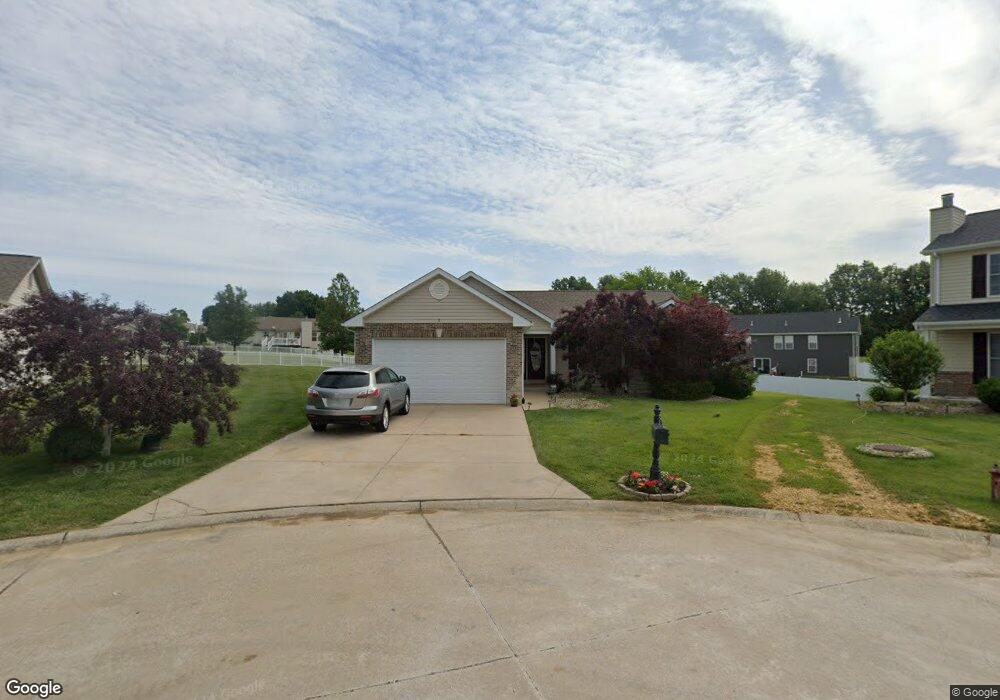
This home is located at 3 Kimber Ct, Troy, MO 63379 and is currently estimated at $345,670, approximately $207 per square foot. 3 Kimber Ct is a home located in Lincoln County with nearby schools including Claude Brown Elementary School, Troy South Middle School, and Troy Buchanan High School.
Ownership History
Date
Name
Owned For
Owner Type
Purchase Details
Closed on
Nov 10, 2020
Sold by
Waldbueser Robert B and Waldbueser Nicolette
Bought by
Mcness Dakota
Current Estimated Value
Home Financials for this Owner
Home Financials are based on the most recent Mortgage that was taken out on this home.
Original Mortgage
$201,010
Outstanding Balance
$178,870
Interest Rate
2.8%
Mortgage Type
New Conventional
Estimated Equity
$166,800
Purchase Details
Closed on
Mar 1, 2018
Sold by
Wheeler Deborah
Bought by
Waldbueser Robert B and Waldbueser Nicolette
Home Financials for this Owner
Home Financials are based on the most recent Mortgage that was taken out on this home.
Original Mortgage
$175,750
Interest Rate
4.04%
Mortgage Type
New Conventional
Purchase Details
Closed on
Jan 5, 2015
Sold by
Massey Bradley James and Massey Melinda Kelli
Bought by
The Bradley James Massey & Melinda Kelli
Purchase Details
Closed on
Aug 17, 2007
Sold by
The Evans Company Llc
Bought by
Wheeler Deborah
Create a Home Valuation Report for This Property
The Home Valuation Report is an in-depth analysis detailing your home's value as well as a comparison with similar homes in the area
Home Values in the Area
Average Home Value in this Area
Purchase History
| Date | Buyer | Sale Price | Title Company |
|---|---|---|---|
| Mcness Dakota | -- | None Available | |
| Waldbueser Robert B | -- | Us Title | |
| The Bradley James Massey & Melinda Kelli | -- | Meyer Title Co | |
| Wheeler Deborah | -- | Meyer Title Co |
Source: Public Records
Mortgage History
| Date | Status | Borrower | Loan Amount |
|---|---|---|---|
| Open | Mcness Dakota | $201,010 | |
| Previous Owner | Waldbueser Robert B | $175,750 |
Source: Public Records
Tax History
| Year | Tax Paid | Tax Assessment Tax Assessment Total Assessment is a certain percentage of the fair market value that is determined by local assessors to be the total taxable value of land and additions on the property. | Land | Improvement |
|---|---|---|---|---|
| 2025 | $2,804 | $45,868 | $6,080 | $39,788 |
| 2024 | $2,646 | $42,461 | $5,130 | $37,331 |
| 2023 | $2,631 | $42,461 | $5,130 | $37,331 |
| 2022 | $2,511 | $40,316 | $5,130 | $35,186 |
| 2021 | $2,524 | $212,190 | $0 | $0 |
| 2020 | $2,202 | $185,000 | $0 | $0 |
| 2019 | $2,205 | $185,000 | $0 | $0 |
| 2018 | $2,272 | $35,781 | $0 | $0 |
| 2017 | $2,278 | $35,781 | $0 | $0 |
| 2016 | $1,726 | $26,431 | $0 | $0 |
| 2015 | $1,730 | $26,431 | $0 | $0 |
| 2014 | $1,735 | $26,431 | $0 | $0 |
| 2013 | -- | $26,452 | $0 | $0 |
Source: Public Records
Map
Nearby Homes
- 192 Rockport Dr
- 189 Rockport Dr
- 299 Rockport Dr
- 791 Glen Eagle Dr
- 760 Glen Eagle Dr
- 60 Sycamore Grove Dr
- 506 Hickory Knoll Dr
- 268 Auburn Ridge Dr
- 269 Auburn Ridge Dr
- 299 Auburn Ridge Dr
- 442 Shady Trail Dr
- 431 Shady Trail Dr
- 1131 Jade Dr
- 149 Sugar Maple Dr
- 14 Stone Bridge Dr
- 140 Hidden Mill Ct
- 130 Stone Bridge Dr
- 380 Crooked Creek View Ln
- 70 Willow Springs Dr
- 1835 Rock Springs Rd
Your Personal Tour Guide
Ask me questions while you tour the home.