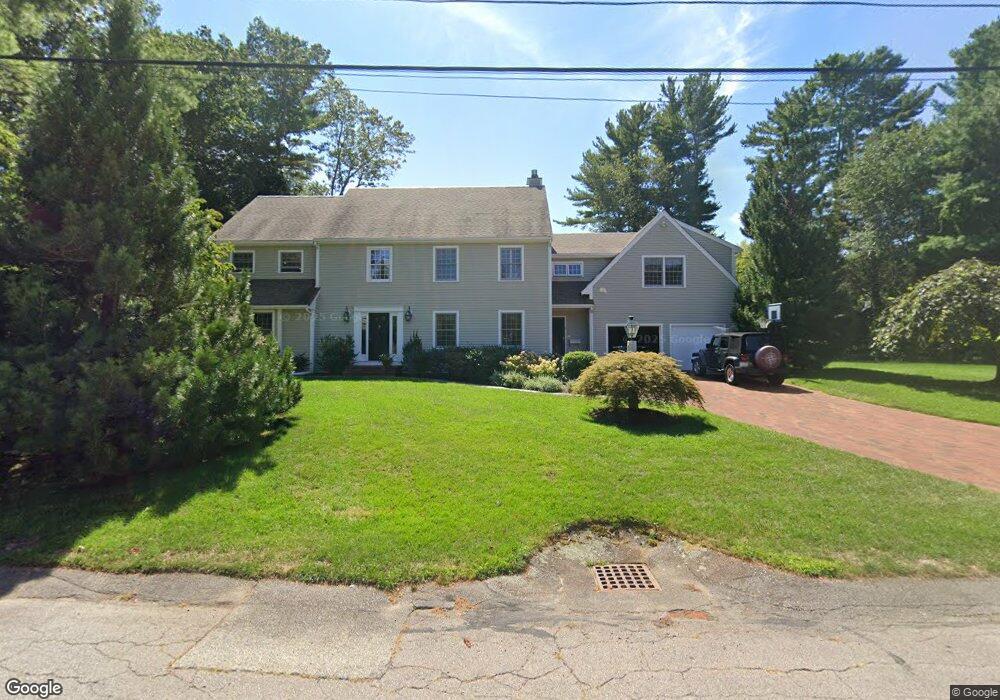
3 King Philip Path Hingham, MA 02043
South Hingham NeighborhoodEstimated Value: $1,664,425 - $1,773,000
4
Beds
4
Baths
3,979
Sq Ft
$429/Sq Ft
Est. Value
About This Home
This home is located at 3 King Philip Path, Hingham, MA 02043 and is currently estimated at $1,705,106, approximately $428 per square foot. 3 King Philip Path is a home located in Plymouth County with nearby schools including South Elementary School, Hingham Middle School, and Hingham High School.
Ownership History
Date
Name
Owned For
Owner Type
Purchase Details
Closed on
Jun 28, 2011
Sold by
Sibor Dawn C and Sibor David W
Bought by
Sibor Dawn C
Current Estimated Value
Home Financials for this Owner
Home Financials are based on the most recent Mortgage that was taken out on this home.
Original Mortgage
$200,000
Interest Rate
4.81%
Purchase Details
Closed on
May 15, 1995
Sold by
Blasetti Romald Ae
Bought by
Sibor Dawn C
Purchase Details
Closed on
Jul 21, 1989
Sold by
Tolle Rt
Bought by
Blasetti Joseph D
Create a Home Valuation Report for This Property
The Home Valuation Report is an in-depth analysis detailing your home's value as well as a comparison with similar homes in the area
Home Values in the Area
Average Home Value in this Area
Purchase History
| Date | Buyer | Sale Price | Title Company |
|---|---|---|---|
| Sibor Dawn C | -- | -- | |
| Sibor Dawn C | $510,000 | -- | |
| Blasetti Joseph D | $375,000 | -- |
Source: Public Records
Mortgage History
| Date | Status | Borrower | Loan Amount |
|---|---|---|---|
| Closed | Blasetti Joseph D | $200,000 | |
| Previous Owner | Blasetti Joseph D | $150,000 | |
| Previous Owner | Blasetti Joseph D | $75,000 |
Source: Public Records
Tax History Compared to Growth
Tax History
| Year | Tax Paid | Tax Assessment Tax Assessment Total Assessment is a certain percentage of the fair market value that is determined by local assessors to be the total taxable value of land and additions on the property. | Land | Improvement |
|---|---|---|---|---|
| 2025 | $14,557 | $1,361,700 | $456,300 | $905,400 |
| 2024 | $13,930 | $1,283,900 | $456,300 | $827,600 |
| 2023 | $12,189 | $1,218,900 | $456,300 | $762,600 |
| 2022 | $11,241 | $972,400 | $352,200 | $620,200 |
| 2021 | $10,930 | $926,300 | $352,200 | $574,100 |
| 2020 | $10,770 | $934,100 | $352,200 | $581,900 |
| 2019 | $10,605 | $898,000 | $352,200 | $545,800 |
| 2018 | $10,569 | $898,000 | $352,200 | $545,800 |
| 2017 | $9,801 | $800,100 | $360,200 | $439,900 |
| 2016 | $9,780 | $783,000 | $343,100 | $439,900 |
| 2015 | $9,608 | $766,800 | $326,900 | $439,900 |
Source: Public Records
Map
Nearby Homes
- 100 Whiting St
- 4 Richard Rd
- 1 Kerri Ln
- 4 Kerri Ln
- 72 Scotland St
- 214 Washington St Unit 24
- 214 Washington St Unit 28
- 18 Colby St
- 205 Pond St
- 3 Blueberry Ct
- 18 Whiting Ln
- 55 Turner Rd
- 251 Prospect St
- 1239 Main St
- 120 Deerfield Ln
- 225 Prospect St
- 375 Webster St
- 7 Assinippi Ave Unit 205
- 7 Assinippi Ave Unit 306
- 2 Black Rock Dr Unit 21
- 8 Queen Anne Ln
- 1 King Philip Path
- 6 Queen Anne Ln
- 5 King Philip Path
- 4 King Philip Path
- 6 King Philip Path
- 10 Queen Anne Ln
- 2 King Philip Path
- 9 Queen Anne Ln
- 8 King Philip Path
- 3 Queen Anne Ln
- 7 Queen Anne Ln
- 12 Queen Anne Ln
- 5 Queen Anne Ln
- 2 Queen Anne Ln
- 1 Queen Anne Ln
- 1166 Main St
- 14 Queen Anne Ln
- 1186 Main St
- 13 Queen Ann Ln